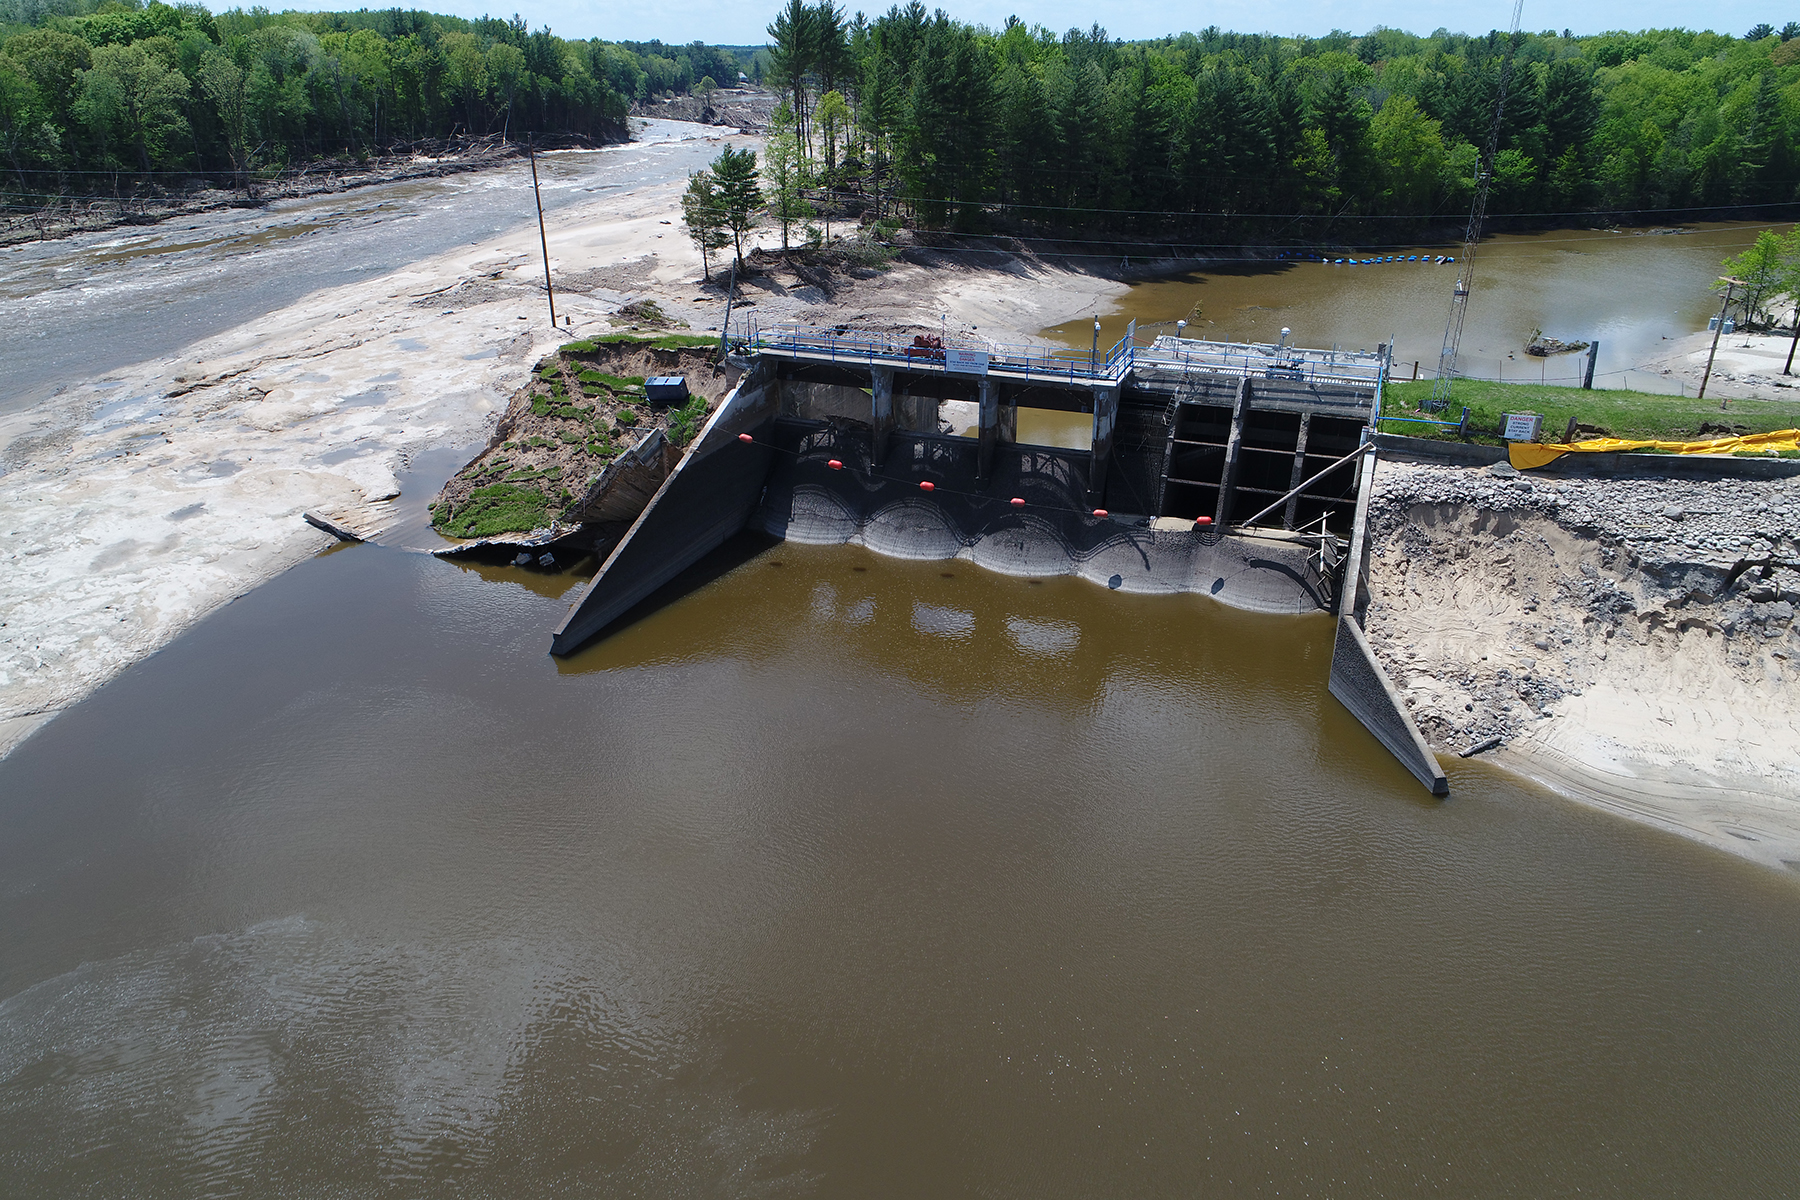
A lesson to be learned from the May 19, 2020 failure of Edenville Dam, MI, is that static liquefaction needs to be considered as a potential failure mode for water dams that include loose sands or silts in their embankments or foundations. Although static liquefaction has been identified as a significant concern for tailing or mine waste dams over the past few decades, it has generally not been considered an issue of concern for water storage dams—dams constructed for the purpose of storing water on a permanent or temporary basis. The failure of Edenville Dam and the Independent Forensic Team’s (IFT’s) conclusion that static liquefaction was the primary cause of the failure (France et al., 2022) has changed that thinking. However, the profession is currently (August 2024) challenged by a lack of widely accepted protocols for assessing the risk of static liquefaction.
This document includes discussion of (a) some background information on static liquefaction, (b) the physics of static liquefaction, and (c) current practices in assessment of static liquefaction. A large literature on static liquefaction exists, and the discussions in this document are brief synopses of certain aspects of the topic. The reader is encouraged to delve into the technical literature for a deeper understanding of the topic. The list of references provided at the end of the document provides a starting point for such research, including the following references that are not cited specifically in this document: Gens, 2019; Jefferies & Been, 2016; Lade, 1994; Lade et al., 1987; Robertson, 2020.
Background
Static liquefaction is a phenomenon in which saturated, loose sand or silt loses strength and collapses rapidly under sustained (static) shear loading, generating high pore water pressure in the soil mass and very low strength. The stress-strain behavior is brittle, and the low residual strength is much lower than the static shear stresses, creating a large force imbalance resulting in acceleration, velocity, and flow of the soil mass. The behavior during failure is referred to as flow liquefaction.
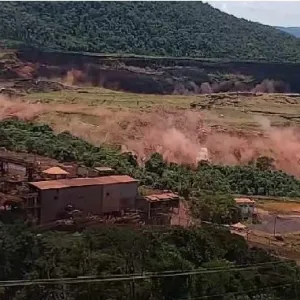
Static liquefaction flow failure is clearly illustrated in video recordings of the Edenville Dam, MI (2020) and Feijão Tailings Dam, Brazil (2019) failures (see links in the “Videos” tab above). These two videos illustrate the following characteristics of static liquefaction flow failure:
- little to no visible signs of distress until just before failure
- rapid failure; typically occurring in seconds or tens of seconds
- dynamic movement of the soil mass, involving accelerations and velocities
- a relatively large soil mass involved in the failure
- relatively large distances traveled by the failing soils
- sometimes jets of water occuring during failure
This observed behavior suggests sudden development of a large force imbalance that creates acceleration of the failure mass, according to the physics equation F = ma (force = mass x acceleration), as discussed further later in this document.
What makes static flow liquefaction failures particularly dangerous is the lack of advance warning signs and the speed of the failure. As a result, the water or tailings stored behind the dam can be released very quickly with essentially no warning, with potentially catastrophic consequences. The Feijão failure resulted in a reported 270 fatalities. The Edenville Dam IFT reported that there likely would have been fatalities from that failure if the downstream population at risk had not been previously evacuated, principally because of concern about the possibility of embankment overtopping (France et al., 2022).
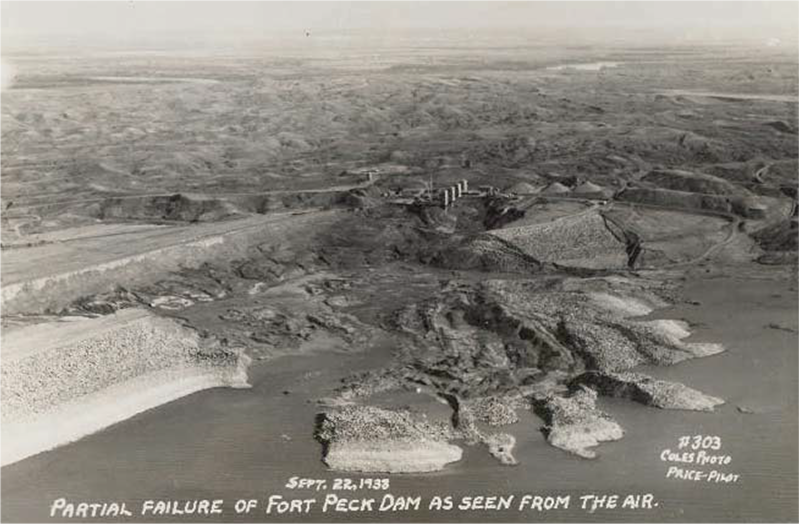
Static liquefaction has been receiving increasing attention in recent years in the tailings dam arena because of a number of tailings dam failures, including Feijão Dam. Although earthquake-triggered liquefaction has been a concern of water storage dam engineers since the failure of the Lower San Fernando Dam in 1973, the potential for liquefaction flow failure of water storage dams has not been typically considered for nonseismic loading. Because earthquake loads are applied very quickly, it is easy to understand why the shaking might generate the high pore water pressures required for liquefaction; the loading occurs more quickly than water can flow into or out of the voids in the soil, even for relatively high permeability sands and gravels. However, it has generally been assumed by most geotechnical engineers that under other loading conditions water will be able to flow in and out of sands, and they will behave drained during shear, with the strength defined by the drained shear strength, regardless of the density of the sand. This view has been held even though static liquefaction failures of water storage dams are not unprecedented. In fact, to the writer’s knowledge, the original reference to “liquefied” soil was in 1920 (Hazen, 1920) in reference to a 1918 static liquefaction failure of Calaveras Dam, CA. Other documented cases of static liquefaction failures of water dams include the 1907 failure of the North Dike of Wachusett Dam, MA (Olson et al., 2000), and the 1938 failure of Fort Peck Dam, MT (U.S. Army Corps of Engineers, 1939).
As will be demonstrated in this document, it is time for our profession to recognize static liquefaction as a potential failure mode for water storage dams having loose sands and silts in their embankments or foundations and develop rational ways to assess and mitigate the potential risks therefrom.
Physics of Static Liquefaction
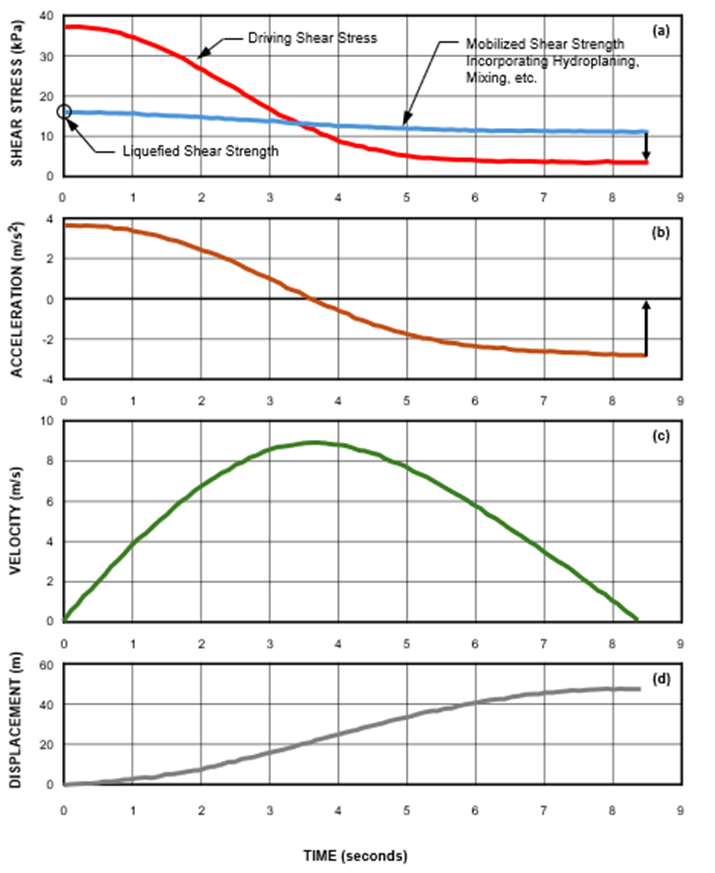
To understand the physics of static liquefaction, it is necessary to understand the kinetics of the phenomenon, the soil stress-strain behavior that generates the kinetics, and the triggers that can initiate static liquefaction. Kinetics The kinetics of static liquefaction are illustrated in Figure 1, which includes plots of shear stress, acceleration, velocity, and displacement versus time for a soil mass during a flow failure. Concentrating first on the shear stress plot, the driving shear stress is the stress created by gravity – the static shear stress. Prior to liquefaction, the available strength of the soil mass is greater than the driving shear stress and the mass is stable. At the instant of liquefaction, the available strength drops suddenly to the liquefied shear strength, which is much less than the driving shear stress. This condition creates a large force imbalance between the forces destabilizing the soil mass and those resisting that destabilization, which results in acceleration of the mass according to F = ma, as shown in the second plot on Figure 1.

The acceleration then leads to velocity, as the mass begins to move, as shown in the third and fourth plots of Figure 1. As the mass moves, the overall slope starts to flatten and the driving stress decreases. The liquefied strength may also decrease to some degree, for several reasons, but it will not decrease as much as the driving shear stress. The acceleration will begin to decrease, because of the reduced imbalance between the driving shear stress and the liquefied strength. Even though acceleration is decreasing, velocity continues to increase because acceleration is still positive.
After some time, acceleration reduces to zero as the slope continues to flatten to the point where the driving stress equals the liquefied shear strength. Movement does not stop at this point because velocity is still positive. In fact, velocity is at its peak at this point.
As movement and slope flattening continue, the driving stress is reduced to less than the liquefied shear strength, acceleration becomes negative and velocity decreases. Eventually, velocity is reduced to zero and movement stops.
From this discussion, it could be suggested that “static liquefaction” is a misnomer. The process is in fact dynamic, including accelerations and velocities that are driven by static gravity loads. Perhaps a term such as “spontaneous liquefaction” would be more appropriate, but like some other misnomers in our profession, static liquefaction is so well established that it would be difficult, and possibly confusing, to change the terminology.
Stress–Strain Behavior
With this understanding of the kinetics of static liquefaction flow failure, what is it about loose sands and silts that can cause it to happen? In particular, how does the rapid decrease in shear strength occur? To answer these questions, we need to consider the stress–strain behavior of loose sands and silts.
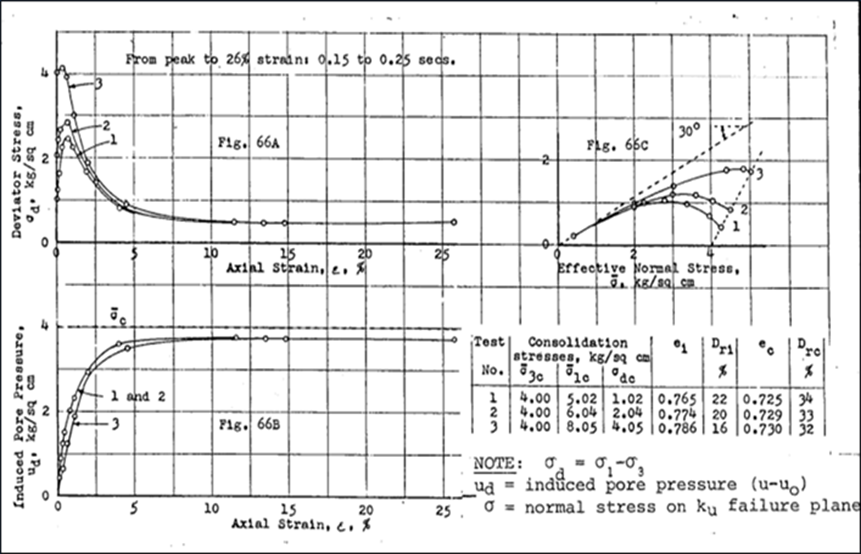
In his research in the 1960s, Dr. Gonzalo Castro demonstrated in the laboratory the stress-strain behavior characteristics that are fundamental to static liquefaction. The results of three of Dr. Castro’s load-controlled, undrained triaxial shear tests are shown in Figure 2. The three plots shown in the figure are deviator stress¹ versus axial strain, induced pore pressure versus axial strain, and deviator stress versus effective normal stress (a stress path). All three tests were conducted on specimens at approximately the same relative density (ranging from 32% to 34%), but at different levels of anisotropic loading (initial deviator stress).
In the deviator stress versus axial strain plot, it is seen that the three specimens all show shear stress increasing to three different peaks, all at very small strains. For each specimen, after a certain peak shear stress is reached, the specimen suddenly loses its ability to resist that shear stress and it dramatically collapses to a point where it can only sustain a much lower shear stress, which then remains constant as strain continues. The lower strength, which is the liquefied strength, is the same for all three specimens because they are all at essentially the same relative density or void ratio. This is consistent with the concept of the steady state of deformation (Poulos, 1981), which is beyond the scope of this summary. It is also important to note that all three specimens strained from peak stress at very low shear strain to 26% strain very quickly, in 0.15 to 0.25 seconds. The stress-strain behavior of these three samples is called “strain-weakening” or “strain-softening”² and is a characteristic of a specimen experiencing static liquefaction, because it produces the required sudden dramatic reduction in shear strength.
Turning now to the induced pore pressure versus strain plot, it is seen that pore pressure increases relatively modestly as the shear stress increases to the peak value. This is then followed by a dramatic increase in pore pressure during the rapid deformation after peak stress is reached. The pore pressures ultimately reach values that are very high but not equal to the effective triaxial confining pressure. These high pore pressures result in very low, but not zero, shear strengths.

The behavior illustrated in these two plots of Figure 2 is fully consistent with the kinetics of static liquefaction described above. Very little strain and very little pore pressure accumulate before a sudden collapse of the soil, which leads to high pore water pressures and very low strengths that can no longer support the applied shear stresses.
Last for Figure 2, we look at the stress path (deviator stress vs. effective normal stress) plot. The drained friction angle of the sand is 30 degrees, and it is seen that the liquefied strength points for all three tests are the same and plot on the 30-degree friction angle line. However, the peak stress points all plot well below the 30-degree friction angle line. Hence, it is seen that the mobilized friction angle at peak undrained strength for loose sands can be significantly less than the drained friction angle.
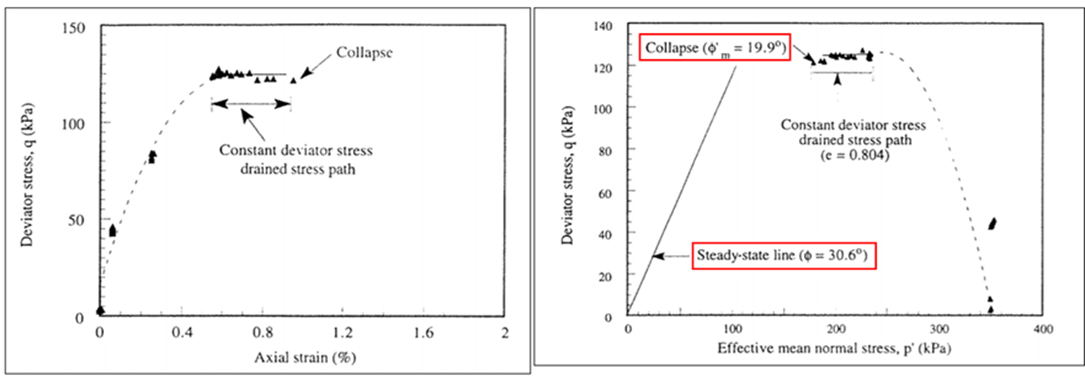
Another important laboratory test was completed in the 1990s as illustrated in Figure 3 (Sasitharan et al., 1993). In this triaxial test, a loose sand specimen was first anisotropically consolidated. Then the deviator stress (or shear stress) was held constant while the pore water pressure was increased, with the drainage valve open. That is, the conditions were drained; water could freely flow into or out of the voids in the sample.

As can be seen in Figure 3, a small amount of strain accumulated under drained conditions (the lefthand plot), and then the specimen suddenly collapsed at a mobilized friction angle much less than the drained friction angle of the soil (the righthand plot). The collapse was sudden and for practical purposes the sample experienced an undrained shear failure. Hence, a drained increase in pore water pressure in a loose sand can trigger an undrained sudden collapse.
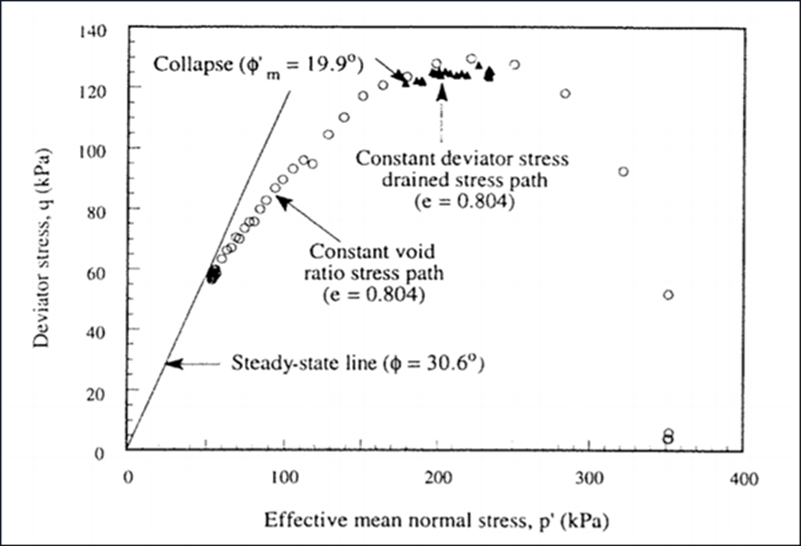
The researchers also looked more closely at the stress path for this test and compared it to the stress path for a constant void ratio (undrained) stress test, as shown in Figure 4. The undrained stress path is similar to those in Figure 2, except that the specimen was isotropically consolidated instead of anisotropically consolidated. From Figure 4, it is seen that the collapse triggered in the constant deviator stress drained stress path test occurred near the peak shear stress state in the constant void ratio (undrained) stress path test.

The results of the tests shown in Figures 3 and 4 led Sasitharan et al., 1993 to findings that can be paraphrased, as follows:
- Slopes can suddenly fail undrained if the soil is very loose and pore pressures rise slowly (drained conditions before undrained collapse).
- The collapse boundary can be significantly below the drained friction angle boundary – in this case a mobilized friction angle of 17˚ to 20˚ compared to a drained friction angle of about 30˚.
- Strain during the drained loading prior to collapse can be very small – 0.4% to 0.6% for this case.
- With this behavior, there would be no clearly observable earth movements prior to sudden collapse.
- Even though a slope may have a conventional factor of safety above 1, based on drained strength, the slope could actually be close to an undetectable, catastrophic undrained failure.
Triggering
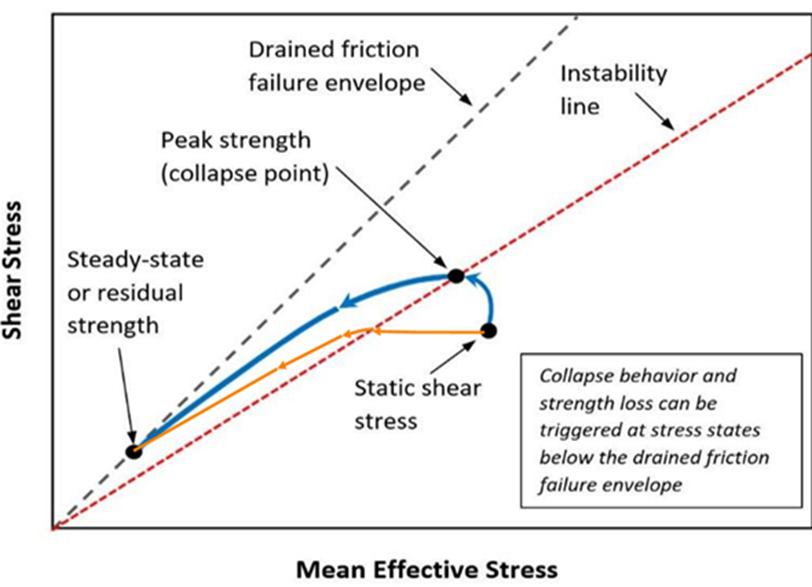
The research results cited above, together with the work of numerous other researchers, have led to a concept of static liquefaction triggering illustrated in Figure 5. In this concept, a loose sand or silt exists with a static shear stress, as would occur beneath an embankment slope. Under this condition, an undrained static liquefaction flow failure could be triggered either by (a) a rapid undrained stress change, as illustrated by the blue line in the figure; (b) a drained increase in pore water pressure, as illustrated by the orange line in the figure; or (c) a combination of the two. Some researchers have also suggested that creep can trigger static liquefaction. In any event, the stress path moves to intersect the instability line, the dashed red line in the figure, and the rapid undrained static liquefaction is triggered. The instability line shown in Figure 5 has been given other names by other researchers (e.g., collapse line, flow liquefaction surface), but the concept is the same.

A number of researchers have investigated the instability line with the results indicating mobilized friction angles on collapse lines ranging from about 14˚ to 22˚ for sands with drained friction angles ranging from 27˚ to 32˚. Kramer,1996 suggested that for “isotropic initial conditions, the slope of the flow liquefaction surface (FLS) (φ’L) is about two-thirds the slope of the drained failure envelope for clean sand.” As noted above, the FLS is the same as the collapse line. Olson and Stark, 2003 suggest that collapse can initiate with ratios of undrained strength to prefailure effective vertical stress (su/σ’v) ranging between 0.23 and 0.31, which correspond to mobilized friction angles of about 13˚ to 17˚. Olson and Stark also suggested equations relating trigger su/σ’v to SPT and CPT values.
Although the concept of triggering of liquefaction is reasonably well understood, the specific details of the triggers are not necessarily well understood for various static liquefaction case histories, at least to a degree of confidence that supports the assessment of the likelihood of specific triggers for a particular dam. The failure of the North Dike of Wachusett Dam is believed to have been caused by rising pore water pressures during reservoir filling (Olson et al., 2000). It has been suggested that the Calaveras Dam failure was caused by rapid embankment placement (Olson, 2001). Slippage on a weak bedding in the foundation shale was suggested as the trigger for failure of Fort Peck Dam (Casagrande, 1965). There have been at least three possible triggers suggested for the Feijão Dam failure (Aroyo & Gens, 2022; Robertson et al., 2019; Zhu et al., 2024). The Edenville Dam IFT concluded that the trigger for the failure of the dam was not entirely clear but was likely some combination of pore water pressure increases and rapid stress changes (France et al., 2022), although the author believes that the trigger was substantially, and possibly entirely, pore water pressure increases from a record high reservoir level.
The lack of complete understanding of static liquefaction triggers leads to challenges in assessing the risk of the phenomenon and the need for remediation or risk reduction actions.
Current Assessment Practices
Although significant research has been done on static liquefaction, and tailings dam practitioners have been concerned with the phenomenon for some time, to the author’s knowledge a consensus approach has not yet been developed for how to assess and address the risk, in particular how to assess triggering. Individual engineers, engineering organizations, owners, and regulators currently are left to apply their best judgments.
To evaluate the options available for assessing the risk of static liquefaction, it is useful to consider the relatively well-established approach for considering seismic liquefaction. This approach answers three questions:
- Are soils potentially susceptible to liquefaction present?
- Will an earthquake trigger liquefaction in these soils?
- If liquefaction is triggered, will the embankment become unstable or suffer unacceptable deformation?\
For static liquefaction, we can answer the first and third questions using essentially the same methods that we use for seismic liquefaction, but the second question presents significant challenges. Regarding the first question, for the earthquake case potentially liquefiable soils are typically identified by low penetration resistances (standard penetration tests or cone penetration tests) in saturated sands and silts. The same is true for static liquefaction. Essentially, any soil that would be considered as potentially susceptible to seismic liquefaction should be considered as potentially susceptible to static liquefaction.
Moving to the third question, for seismic liquefaction, if it is concluded that potentially liquefiable soils are present and the expected earthquake loading would trigger liquefaction, then assessments are made of potential instability or deformation considering that the strength of the soil is reduced to the liquefied value. These analyses can be completed using limit equilibrium slope stability analyses or numerical deformation analyses. If it is concluded that static liquefaction is likely, the analyses would be essentially the same using the same or similar analytic techniques.
The second question is where things diverge. For seismic liquefaction there are established procedures for assessing whether the expected earthquake will trigger liquefaction. These procedures compare the expected earthquake loading (e.g., the cyclic stress ratio, CSR) to some measure of resistance to liquefaction (e.g., the cyclic resistance ratio, CRR) to judge whether liquefaction is likely to be triggered. As discussed above, at present the triggers for static liquefaction are not as precisely understood and there is no accepted procedure for assessing triggering of static liquefaction. This leaves practitioners challenged regarding how to proceed.
Some practitioners suggest that, given the current state of knowledge, if the consequences of failure are high (e.g., potential loss of life) the dam should be evaluated, and if necessary remediated, based on the estimated liquefied strength (i.e., assume that, if it can liquefy, it will liquefy). The arguments for this approach are based on (a) the fact that the soils in question exist in a metastable state with the potential for sudden large strength loss, (b) we do not have a good understanding of the triggers, and (c) adequate advance warning of the failure is unlikely. The main argument against this approach is that it may be too conservative, as many dams and slopes exist with shear stresses greater than their liquefied strengths, and sufficient triggers may not be likely. Even with this approach there is not clear agreement on the details. For example, what is an appropriate factor of safety for a post-liquefaction stability analysis? A factor of safety of 1.5 is probably higher than required because the liquefied strength is a lower bound, but is 1.1 high enough or is 1.2 or 1.3 more appropriate?
Other practitioners have suggested that evaluations could be based on comparison of the existing stress state to the instability line, but questions have been raised regarding how confidently the instability line and the in-situ stress state can be estimated in practice and how far below the instability line is acceptable.
It would be desirable to be able to evaluate the likelihood of triggering, as is done for seismic liquefaction, but that will require future research and is likely some time off in the future. It is hoped that the profession will come together to develop consensus protocols and procedures, but until that time, as noted above, individual engineers, engineering organizations, owners, and regulators are left to apply their best judgments based on their understanding of the phenomenon.
¹ In a triaxial shear test, deviator stress = σ₁ – σ₃, which is twice the shear stress = (σ₁ – σ₃)/2.
² This stress–strain behavior has most often been referred to as strain softening, but the writer believes that strain weakening is more appropriate because the behavior relates principally to strength rather than modulus.
References
(3) Castro, G. (1969). Liquefaction of sands [PhD thesis]. Harvard Soil Mechanics Series, 81. Harvard University.
(7) Jefferies, M., & Been, K. (2016). Soil liquefaction: A critical state approach, second edition. CRC Press.
(8) Kramer, S.L. (1996). Geotechnical earthquake engineering. Prentice Hall.
(18) USACE. (1939). Report on the slide of a portion of the upstream face of the Fort Peck Dam, Fort Peck, Montana. US Army Corps of Engineers. United States Government Printing Office.
Acknowledgements: The writer acknowledges with appreciation the thoughtful reviews of this document completed by Dr. Tiffany Adams, Dr. Gonzalo Castro, Dr. Kaare Hoeg, Dr. Allen Marr, Mr. Paul Ridlen, Mr. Christopher Saucier, Ms. Jennifer Williams, and Ms. Christina Winckler.


Edenville Dam (Michigan, 2020)

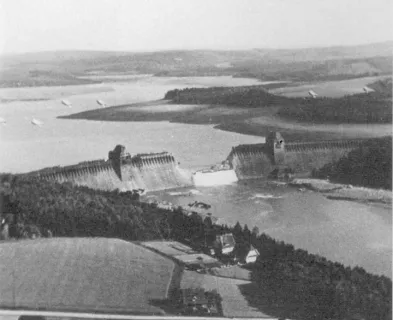
Fort Peck Dam (Montana, 1938)
Feijão Dam B-1 (Brazil, 2019)
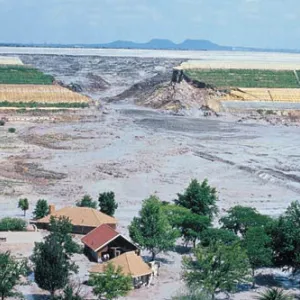
Harmony Gold Mine No. 4 Tailings Dam (South Africa, 1994)
Additional Case Studies (Not Yet Developed)
- Feijão Tailings Dam (Brazil, 2019)