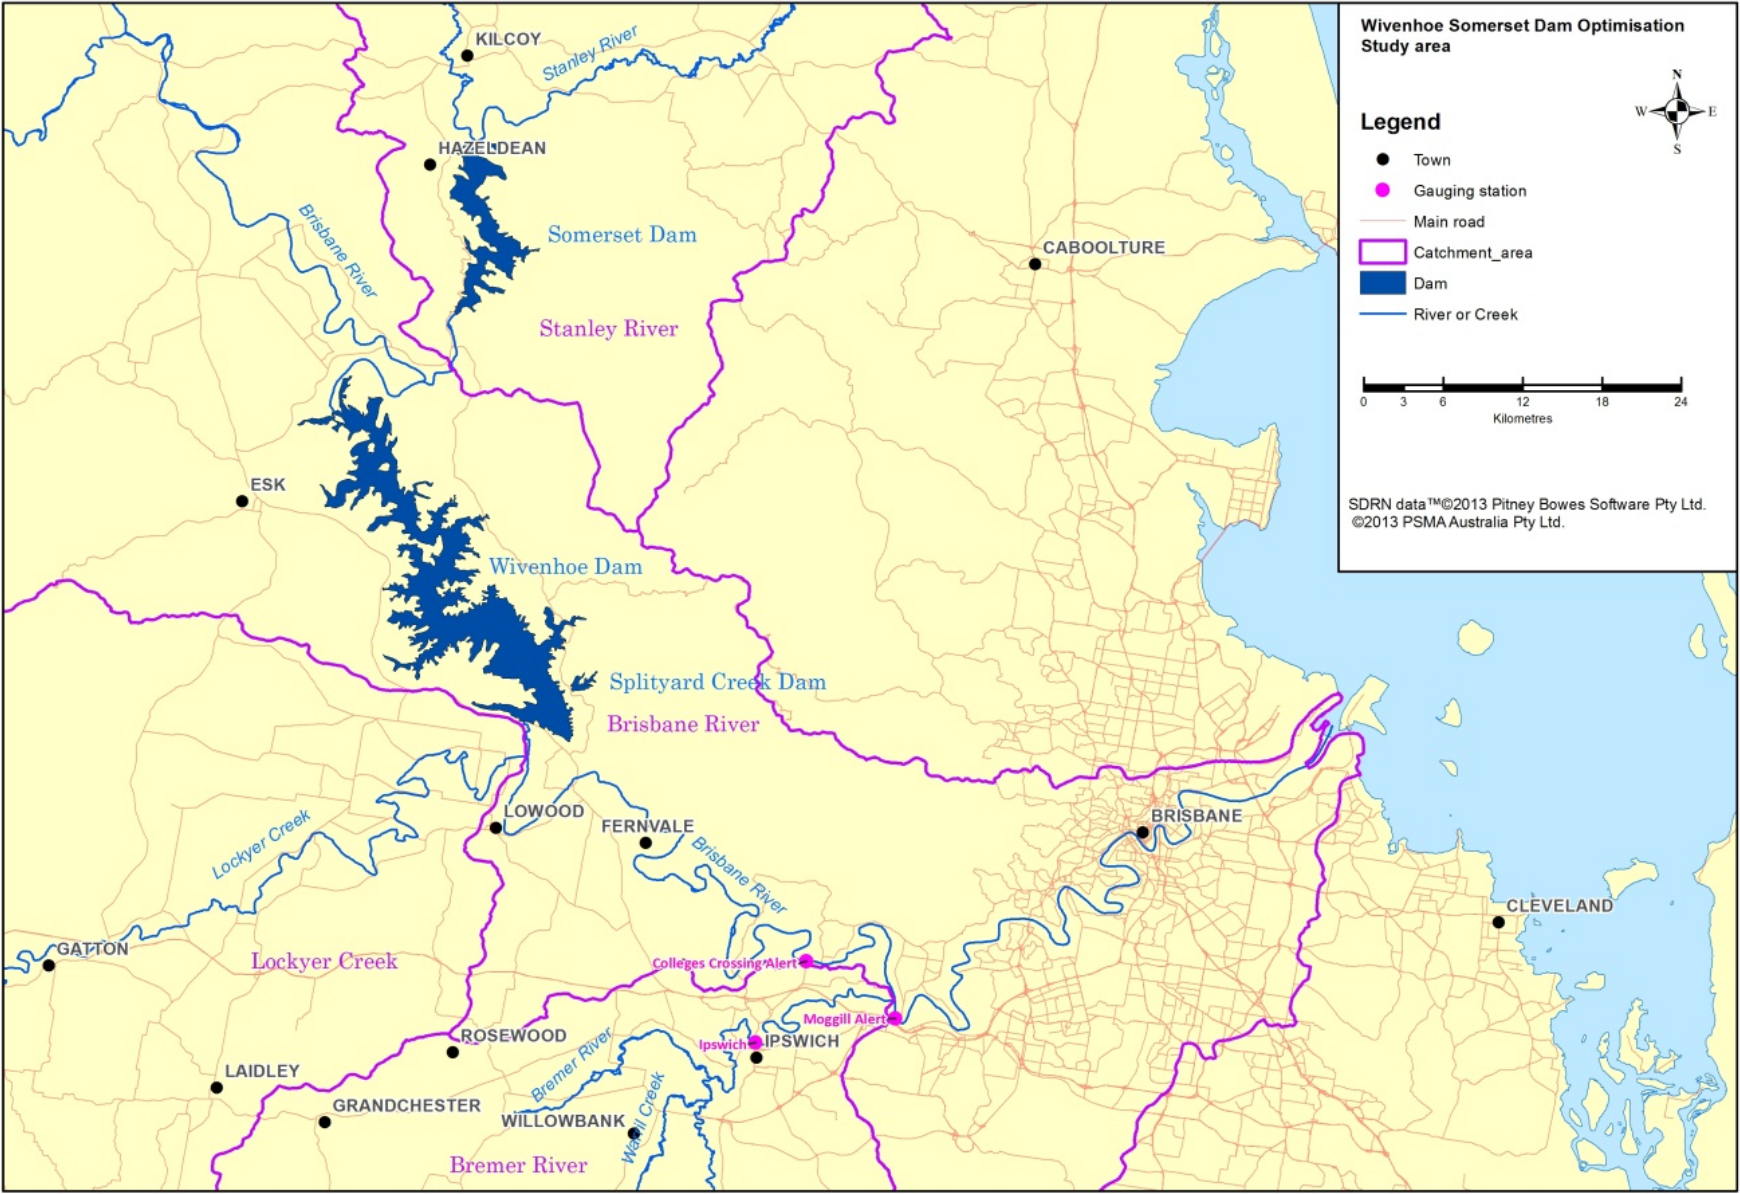
Wivenhoe Dam is situated on the Brisbane River in Queensland, Australia, with a total catchment area of 2,710 square miles. Somerset Dam is located upstream of Wivenhoe Dam with a drainage of 520 square miles. The dams are operated as water supply and flood control reservoirs by Seqwater, the Queensland Government Bulk Water Supply Authority. Construction on Wivenhoe Dam was completed in 1984. The dam has a total storage capacity of 2.5 million acre-feet, with a normal storage capacity (full supply storage) of 945,000 acre-feet and a flood storage capacity of 1.6 million acre-feet. The top of dam elevation is 80.1 meters (m). The main spillway consists of a gated ogee control section, with a crest elevation of 57 m and five radial gates that are 16.6 m (54.5 feet) tall. The dam also has an auxiliary spillway consisting of three fuse plug sections with crest elevations of 75.7 m, 76.2 m, and 76.7 m (61.3 to 64.6 feet above the ogee spillway crest). The dams received their first real test during a January 2011 flood.
In June 2010, a La Niña event was predicted in the Pacific Ocean for the second half of the year. Coupled with the La Niña event, Australia also experienced above average monsoonal rainfall between October 2010 and January 2011, which resulted in the wettest December on record (note that December in Australia is high summer). With catchments already saturated by the end of December 2010, widespread flooding was experienced when extreme precipitation continued into January 2011 (QFCI 2011).
Wivenhoe Dam Flood Operation Strategies
The November 2009 version of the Manual of Operational Procedures for Flood Mitigation at Wivenhoe Dam and Somerset Dam (“the manual”), the version that governed flood operations during the January 2011 event, states that the two dams were to be operated in tandem “so as to maximize the overall flood mitigation capabilities of the two dams.” The manual then outlines strategies for this tandem operation. Three flood mitigation release strategies are defined for Somerset Dam: S1, S2, and S3; and four for Wivenhoe: W1, W2, W3, and W4. All three Somerset flood mitigation release strategies are based on projected water surface elevations in both Somerset and Wivenhoe Dams:
- S1: Use if Somerset pool level is expected to exceed El. 99 m, and Wivenhoe pool level is not likely to exceed its full supply level. Strategy for minimizing impact on rural upstream populations.
- S2: Use if Somerset pool level is expected to exceed El. 99 m, and Wivenhoe pool level is likely to exceed its full supply level, but a Wivenhoe fuse plug is not likely to be initiated. Strategy to minimize impacts below Wivenhoe Dam.
- S3: Use if Somerset pool level is expected to exceed El. 99 m, and Wivenhoe pool level is likely to exceed its full supply level, and a Wivenhoe fuse plug is likely to be initiated. Strategy to protect the structural safety of Somerset Dam.

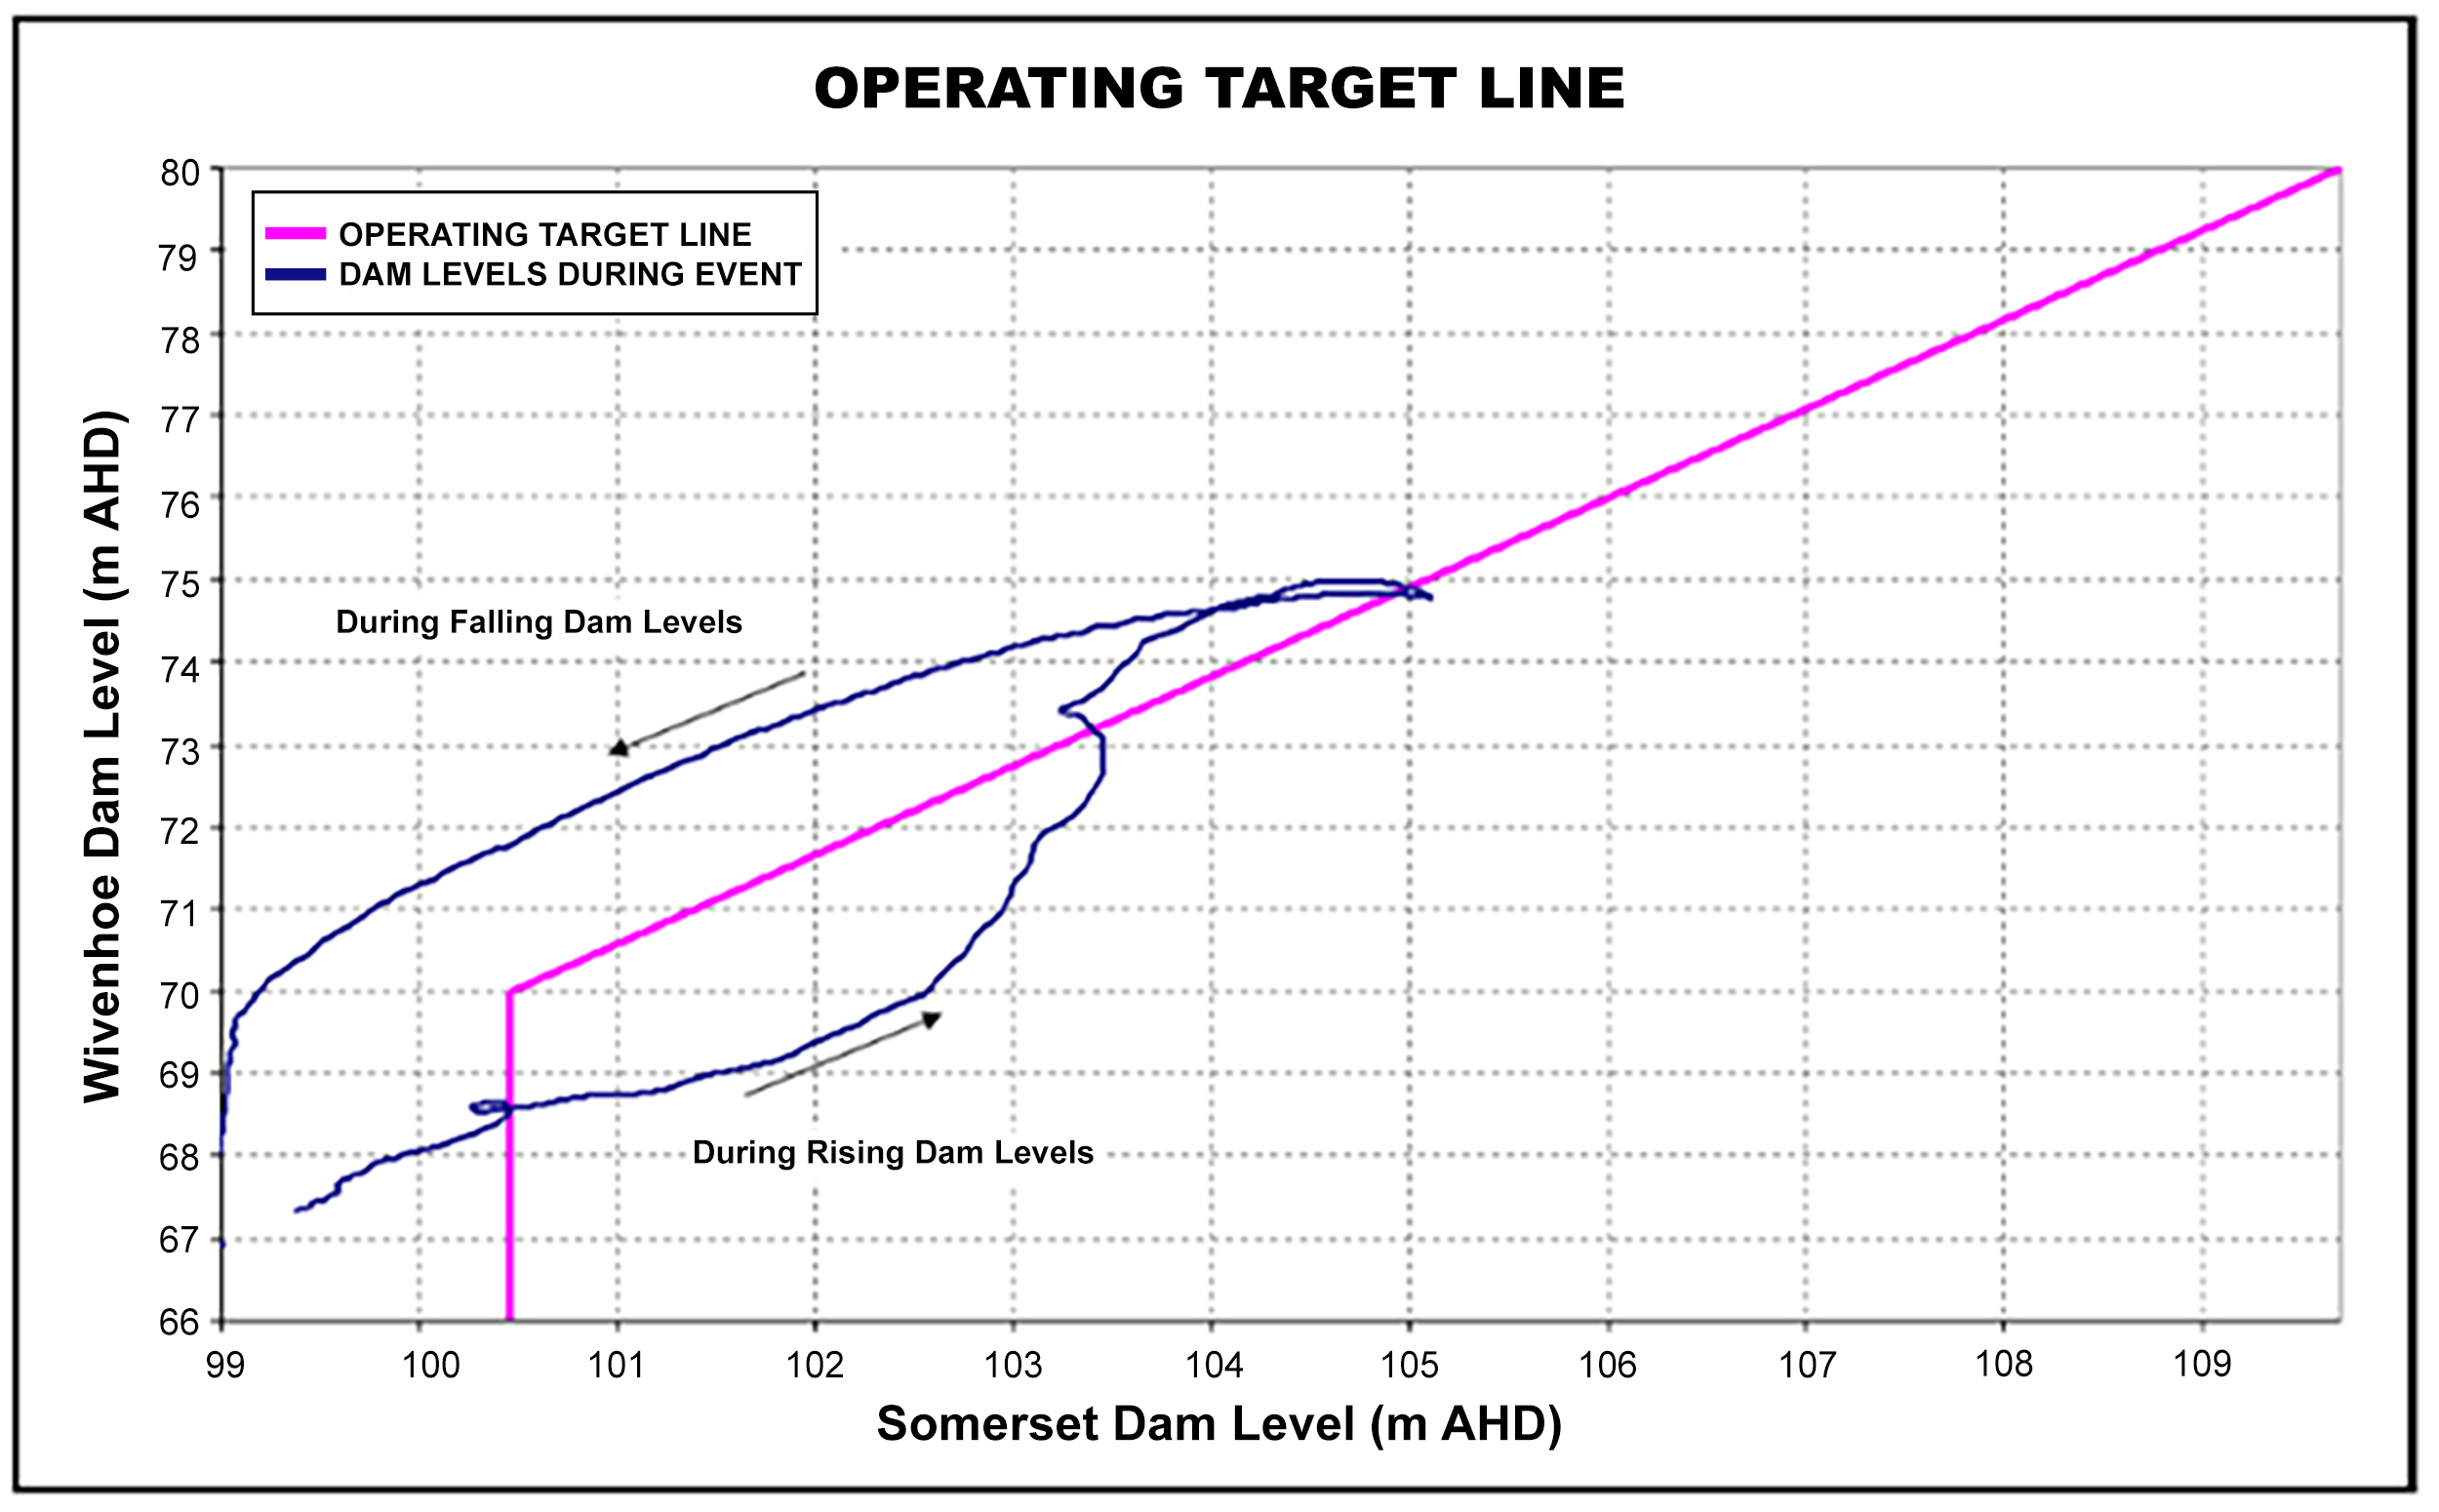
Based on the November 2009 manual, actual release rates at Somerset were to be coordinated based on an operating target line that linearly related Somerset pool levels to Wivenhoe pool levels (Seqwater 2011). The release strategies for Wivenhoe Dam are more complex due to the downstream consequences. These release strategies are summarized in more detail because an understanding of each is required to better understand the operational incident itself:
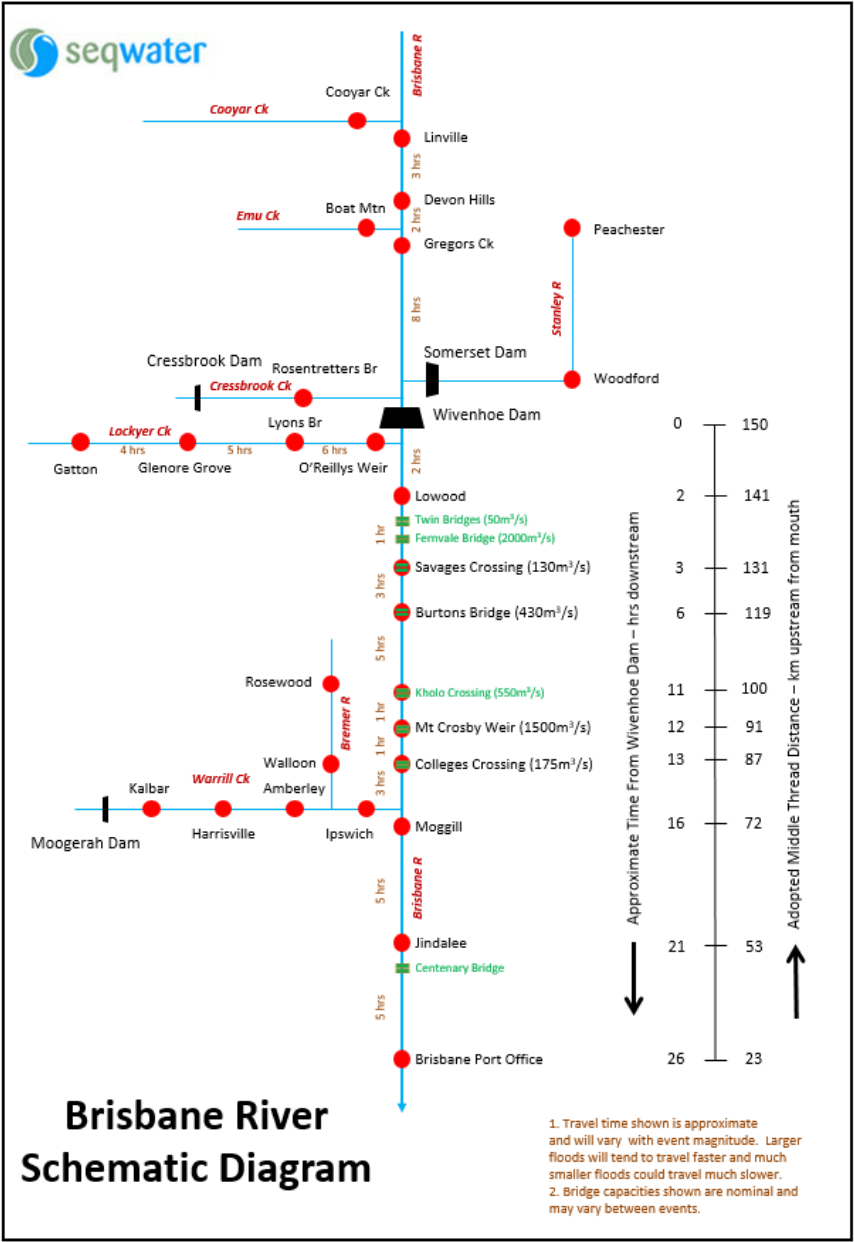
- W1: An initial strategy for minimizing disruption to downstream rural populations. This is achieved by defining the discharge thresholds at which various downstream bridges would submerge. Applicable for reservoir levels lower than El. 68.5 m and a maximum release rate of 1,900 cubic meters per second (m3/s) or 67,000 cubic feet per second (cfs), which is the limit of submergence for the most downstream bridge considered.
- W2: A transitional strategy from limiting rural disturbance to protecting urban areas further downstream from inundation. Applicable for reservoir levels between 68.5 m and 74 m. The maximum allowable release is 3,500 m3/s (124,000 cfs); this rate is the threshold for damaging flood flows at Lowood, a rural community immediately downstream of the dam near the confluence of Lockyer Creek. The manual also instructs that the target maximum flow in the Brisbane River (i.e., target dam releases) should be the lesser of the natural peak (excluding dam releases) at Lowood and 3,500 m3/s (124,000 cfs), while at Moggill (the rural community near the next confluence with the Bremer River) should be the lesser of the natural peak and 4,000 m3/s (141,000 cfs).
- W3: Strategy for protecting urban areas from inundation. Like W2, strategy W3 is also applicable between EL. 68.5 m and 74 m. The maximum allowable release is 4,000 m3/s (141,000 cfs), which is the threshold for damaging flood flows at the downstream community of Moggill.
- W4: Strategy for protecting the structural safety of the dam. This strategy is employed when predicted lake levels are anticipated to exceed El. 74 m. There is no limit to release rates.
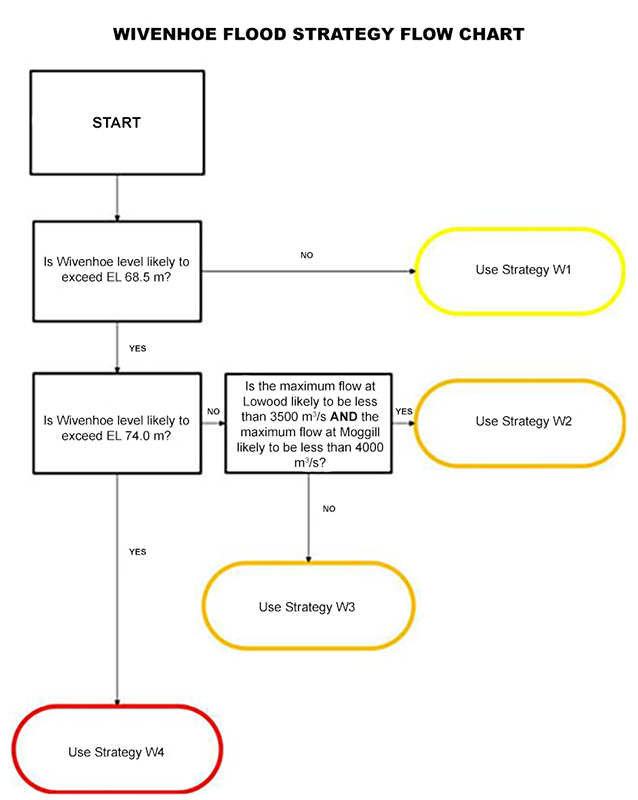
The manual states that consideration for lower-level objectives, i.e., the objectives of lower release strategies, should still be considered in order of importance when operating above W1. The manual also provides a flowchart to assist flood operations engineers in the implementation of each strategy based on the likelihood of the reservoir reaching each target pool level threshold; its use is informed by a real time flood model for forecasting reservoir levels and downstream peak flows (Seqwater 2009).

The manual contained conflicting information between the flowchart and the description of Strategy W2. If Wivenhoe reservoir levels are not anticipated to exceed El. 74 m, the flowchart asks the operator the following question: Is the maximum flow at Lowood likely to be less than 3,500 m3/s AND the maximum flow at Moggill likely to be less than 4,000 m3/s? If so, Strategy W2 is to be implemented, if not Strategy W3. What the flowchart does not consider is the caveat to that question, which is given in the description of W2, four pages later. It states that target flows in the Brisbane River (i.e., releases from Wivenhoe Dam) are to be less than the natural peaks at Lowood and Moggill unless those peaks are greater than 3,500 m3/s and 4,000 m3/s, respectively. This discrepancy between the strategy selection flowchart and description of W2 within the manual becomes important in assessing the operational incident. Note that the manual has since been revised, and the dams are no longer operated under these strategies.
Chronology of Strategy Changes
The March 2011 Report on the operation of Somerset Dam and Wivenhoe Dam developed by the owner, Seqwater, summarizes the operational procedures taken at each dam during the January 2011 event. According to this report, Somerset Dam was operated under Strategy S2 for the duration of the event in an effort to maintain the dams’ pool levels at the operating target line (Seqwater 2011).
At Wivenhoe Dam, the operators transitioned from Strategy W1 to W3 at 8:00 am on January 8, 2011, as it became apparent that Wivenhoe pool levels would exceed El. 68.5 m. The report further states that Strategy W2 was bypassed because the dam’s release rate of 940 m3/s had already surpassed the natural occurring peaks at Lockwood and Moggill of 530 m3/s and 770 m3/s, respectively (Seqwater 2011). Therefore, W2, per the manual’s description (not the flowchart), would have required releases from the dam to be decreased to less than those natural occurring peaks, which was not prudent due to the rising reservoir level (QFCI 2012).

As described in the report, Strategy W3 was employed until it became apparent that the reservoir level would exceed El. 74 m due to extreme rainfall intensities (later estimated to exceed the 0.05% AEP intensities, approximately a 2,000-year recurrence interval event). At that point, 8:00 am January 11, 2011, the operators transitioned to Strategy W4 where the primary objective was preserving the integrity of the dam and significant urban flood damage was unavoidable. While operating in W4, lake levels rose to El. 74.97 m, only 0.73 m below the first fuse plug’s trigger elevation. After this period the pool level stabilized and the lake eventually fell to El. 66.89 m by January 19, 2011 (Seqwater 2011).
Findings of the Queensland Floods Commission of Inquiry (QFCI)
On January 17, 2011, the Queensland Government established the Commission of Inquiry into the 2010/2011 flood events with the purpose of inquiring into the preparation for, operations during, and performance of insurers after the 2010/2011 flood events. In the QFCI’s March 2012 Final Report, investigations regarding the adherence to the Wivenhoe and Somerset flood operations manual by the flood operations engineers is summarized. The investigations bring to light discrepancies between the March 2011 official flood event report and various other records including gate operations spreadsheets, situation reports, emails, and other official documents prepared prior to the March 2011 report. While many of the records contradict each other, the most compelling contradiction is when the shift from W1 occurred and whether that shift was to W2 or W3 (QFCI 2012).
The Seqwater flood event report states that W2 was bypassed and W3 was implemented at 8:00 am on January 8th. The QFCI investigation [did not agree with the flood event report and instead] concluded that the engineers did not contemplate a need to shift out of W1 until the afternoon of January 9th; the engineers also acknowledged that operations were at the limit between W1 and W2, not W3. At 7:00 pm January 9th, the engineers elevated release rates, though no strategy change was documented. Because no change was documented, and because it is unclear which operational strategy was in employment, the QFCI concludes that Wivenhoe Dam was operated in breach of the manual between January 8th and 9th. The QFCI also concludes that the March 2011 flood event report was a reconstruction of what release strategies should have been employed and not an accurate representation of the engineers’ actions and states of mind during the event (QFCI 2012).
Because of the discrepancies noted above, the QFCI recommended that the Queensland Criminal and Misconduct Commission (CMC) investigate whether the engineers’ preparation of these documents and oral testimonies give evidence to a criminal activity or misconduct (QFCI 2012). In August 2012, the CMC exonerated the engineers. The trial concluded that a conflicting and poorly drafted flood operations manual was the reason for confusion during the event and afterwards while trying to document it (Brisbane Times 2012).

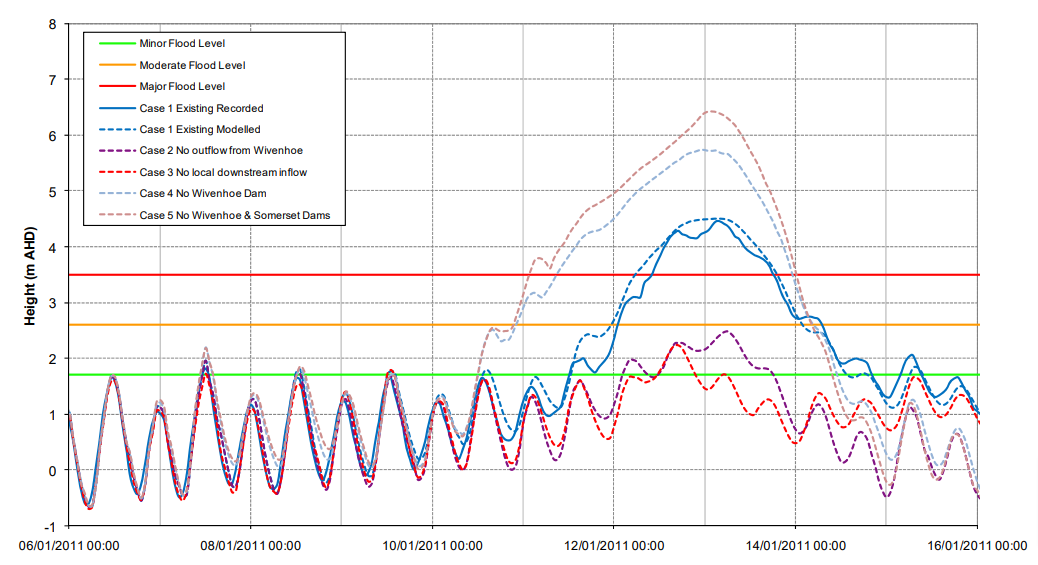
Prior to the criminal investigation, local media appeared to spread the message that the operation in breach of the manual caused unnecessary flooding. The QFCI hired a hydrologic and hydraulic (H&H) engineering consultant to investigate the dam releases’ contribution to overall flooding. The consultant concluded that the dam was operated so that its flood mitigation efforts were near optimal. In hindsight, the QFCI report states that higher releases may have been warranted on the afternoon of the 9th and that bridge access considerations could have been dismissed at that point. However, this scenario would have also required reliance upon rainfall forecast data which had a lot of uncertainty at the time (QFCI 2012). The H&H consultant points out that no one strategy can be optimized for every possible flow scenario (WMAwater 2011). Overall, Wivenhoe and Somerset Dams appeared to reduce flood depths between 1.5 m and 3 m in Brisbane during the January 2011 event (Sinclair Knight Merz 2011). During the December 2010/January 2011 floods, a total of 33 people were killed with 3 still missing (presumed dead) (QFCI 2012). However, zero fatalities can be attributed to the operation of the dams. The floods also resulted in $2.38B AUD ($1 AUD was equivalent to approximately $1 USD at the time of flooding) in damages (Australian Geographic 2012). It is difficult to quantify how much of this damage was caused by the dams and their operation. The cited studies have shown that if the dams were not in place, the flooding and societal impacts would have been worse.
Lessons Learned
As a result of the investigation and findings of the QFCI, it appears that a poorly drafted operations manual is to blame for any confusion among the flood operations engineers during the event. This incident points to the contribution of human factors in both the development of the manual and its interpretation during the dam’s first real test as a flood mitigation structure. This incident also points to the importance of periodically assessing operation and maintenance (O&M) manuals. During these periodic assessments, and for gated flood control structures specifically, it may be wise to hold a tabletop exercise using a flood model to simulate hypothetical flooding scenarios requiring the operators to interpret and adhere to the O&M manual to make hypothetical releases in real time. This exercise would provide the assessors with a better understanding of the O&M manual’s effectiveness and potential flaws when operating under flood control release strategies and allow for appropriate revisions to be made.
Since the January 2011 flood, the Manual of Operational Procedures for Flood Mitigation at Wivenhoe Dam and Somerset Dam has undergone nine revisions with a major revision occurring in November 2014 as the result of the Wivenhoe and Somerset Dams Optimisation Study (WSDOS) (Seqwater 2021), which investigated alternative strategies for operating the dams during flood events using multiple historical and stochastic flood events (WSDOS 2014).
While the engineers were exonerated from any criminal charges, a class action lawsuit in 2019 ruled in favor of the flood victims, stating that the owner of Wivenhoe and Somerset Dams, Seqwater, was responsible for 50% of the losses, while the Queensland Government was responsible for 20%, and a separate state-owned water supplier, Sunwater, was responsible for 30%. In February 2021, the Queensland Government and Sunwater agreed to pay out their portion equaling $440M AUD (The Guardian 2021). Seqwater appealed the 2019 ruling in February 2020 and won their appeal in September 2021 (Brisbane Times 2021). The flood victims are challenging the appeal ruling in the High Court of Australia (The West Australian 2021) (comparable in function to the Supreme Court of the United States); this process is ongoing as of March 2022.
References
(4) QFCI. (2012). Final Report. Queensland Floods Commission of Inquiry.
(5) QFCI. (2011). Interim Report. Queensland Floods Commission of Inquiry.
(7) Seqwater. (2009). Manual of Operational Procedures for Flood Mitigation. Revision 7.
8) Seqwater. (2021). Manual of Operational Procedures for Flood Mitigation. Revision 16.
This case study summary was peer-reviewed by Bill Johnstone, Ph.D, P.E., Spatial Vision; Irfan Alvi, P.E., Alvi Associates, Inc.; and Mike Hand, P.E., WYOH2OPE.


Lessons Learned

Dam incidents and failures can fundamentally be attributed to human factors.
Learn more
Downstream flooding can be caused by spillway flows that exceed channel capacity or as a result of reservoir misoperation.
Learn more
Extreme floods do occur.
Learn moreAdditional Lessons Learned (Not Yet Developed)
- Operations and maintenance manuals should be periodically assessed and revised.
- No single flood operation procedure will be ideal for all potential flood events. Various historical and/or stochastic events may need to be evaluated in determining flood operation release strategies.
- Dams can serve a vital role in mitigating flood damages.