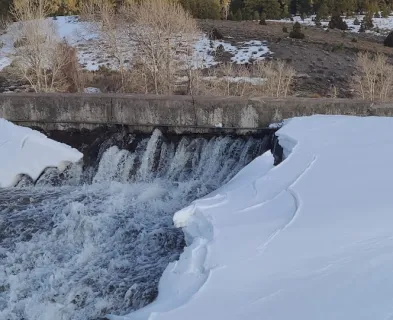
Extreme floods do occur.
There is significant historical evidence that extreme floods and even Probable Maximum Flood (PMF) magnitude floods do in fact occur. It is also true that one of the most common deficiencies identified at existing dams is inadequate spillway capacity. Both of these are evidenced by that fact that overtopping due to insufficient spillway capacity during flood events (whether they approach the PMF magnitude or not) is one of the most common failure modes for dams, causing approximately 34 percent of all failures in the United States (ASDSO, 2020). In light of this information, dam owners, operators, engineers and regulators should recognize that extreme floods can and do occur and take appropriate action to mitigate the risks of such events.
In the early period of dam building in the United States, design flood selection began primarily as a practical concern for protection of a dam and the benefits it provides. Regulatory guidelines and design standards for the hydrologic safety of dams, if there were any, were based mainly on engineering judgment and experience. Decades of dam building experience since then have greatly increased the understanding of the risks and liabilities associated with dams. At the same time, engineering methods for analyzing runoff potential of a watershed during an extreme hydrologic event have also improved. This increased understanding of both the risks inherent to dams as well as the potential for extreme floods has led regulators to adopt spillway design standards that are typically more stringent than those used in the past (learn more on this topic here). As a result, one of the most common deficiencies at older dams is inadequate spillway capacity.
Critical infrastructure, such as dams, skyscrapers, or nuclear power plants, which pose a risk to human life are designed to withstand extreme events because of the catastrophic impacts that could result due to failure of the structure. For example, in many state and federal dam safety jurisdictions, the regulatory design flood for a high hazard potential dam (a dam where loss of life would likely occur if the dam failed) is the PMF, or the flood resulting from the Probable Maximum Precipitation (PMP). The PMP is “theoretically, the greatest depth of precipitation for a given duration that is physically possible over a given storm area at a particular geographical location at a certain time of the year” (World Meteorological Organization, 2009). The PMF varies significantly based on geographic location, watershed size, and storm duration but is often many times greater in magnitude than the one percent annual exceedance probability flood (more commonly known as the 100-year flood).
Because floods of this magnitude are not common, the necessity for dams to be able to handle such extreme events is often questioned. This is true not only of some dam owners who are required to make costly improvements to their dams to pass larger floods, but also by many within the dam safety engineering and regulatory communities. In fact, in a recent survey of state and federal dam safety regulators, only 51 percent of respondents felt that using the PMP/PMF as a design criterion for high hazard dams was reasonable (FEMA, 2012).
While these misgivings are understandable, it is important to remember that even though an extreme rainfall event may not have occurred previously at a given dam or watershed, these events do occur, are quantifiable and their likeliness is predictable. These events are not random, unpredictable acts of God. Rather, they are foreseeable and, in many cases, should serve as the basis of design for critical dams where human lives are at risk (ASDSO, 2015). In accordance with FEMA’s Federal Guidelines for Dam Safety, a less conservative design flood should only be allowed in cases where incremental consequences due to failure during the design flood are inconsequential or when detailed risk assessment indicates that it is acceptable (FEMA, 2013).
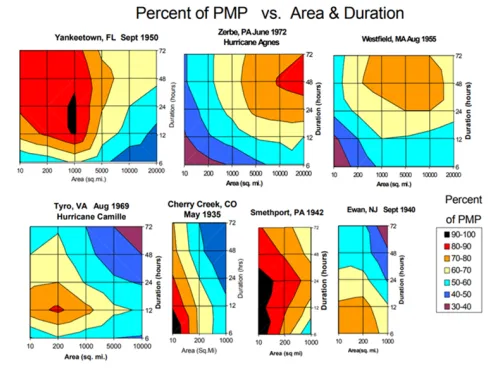
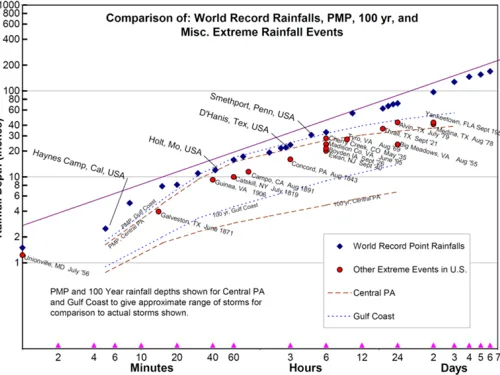
Many studies of historical storm records have been performed to identify and better understand extreme hydrologic events. Studies have consistently found that “extremely rare floods approaching PMF magnitude have occurred and will continue to occur” (Bullard, 1986). It is also anticipated that extreme storms will increase in magnitude over time as a result of climate change (Kunkel, 2020). In addition to rainfall, extreme floods can also be triggered or exacerbated by unusual hydrologic conditions in the watershed (e.g. rain-on-snow, frozen ground, large burn scars, or ice jams). The following examples illustrate that rainfall depths approaching or even equivalent to the PMP have occurred in many areas across the United States:
- Smethport Storm (Pennsylvania, 1942). The Smethport Storm of July 18, 1942 was a world-record setting event for the 3- and 4.5-hour durations at 28.5 and 30.8 inches, respectively (PADEP, 2019). Fifteen fatalities were caused by the flood. Damage included overtopping of dikes and subsequent flooding of Emporium, PA; overtopping and failure of multiple dams near Austin and Johnsonburg, PA; numerous buildings knocked off of foundations; over 75 miles of severely damaged railroad track; and massive debris flows (Harrison, 2006). In some areas, it was estimated that the rainfall rate for short periods was as high as 40 inches per hour. “Many people said the rain did not come down in drops, and they had the visual impression, at least, that the rain came down in streams which they likened to strings and ropes… There were people who had not been able to reach shelter and were afraid they would drown during the downpour through lack of oxygen. One man expressed the effect by saying it was just like breaking water after a long dive, lungs bursting, with water pouring down over his head” (Eisenlohr, 1952).
“The rain did not come down in drops, [it] came down in streams like strings and ropes. People who had not been able to reach shelter were afraid they would drown during the downpour through lack of oxygen.” - Firsthand description of extreme rainfall during the 1942 Smethport, PA storm (Eisenlohr, 1952).
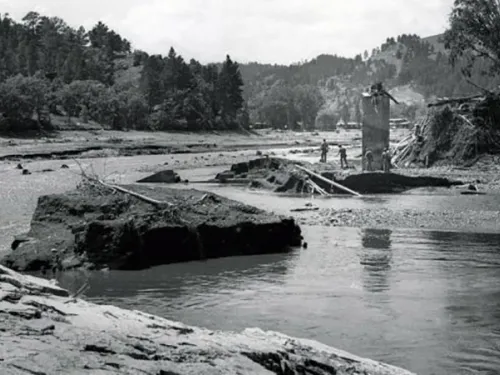
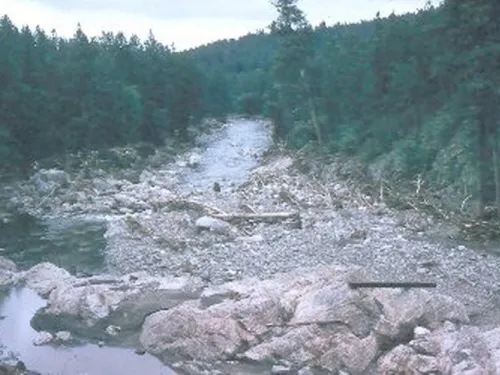
- Black Hills Flood (South Dakota, 1972). The two isolated thunderstorms that struck the area on June 9, 1972 produced a total of 15 inches of rain near Nemo, South Dakota including an average of 10 inches over a 60 square mile area in just 6 hours. “Using a duration of 6 hours and an area coverage of 10 square miles, the highest observed rainfall near Nemo would constitute about 90 percent of the probable maximum precipitation” (NOAA, 1972). The resultant flood caused an estimated 238 fatalities and significant damage in Rapid City, South Dakota, including the overtopping and failure of Canyon Lake Dam; damage or destruction of approximately 3,800 homes; washouts at numerous bridges; and totaling of approximately 5,000 automobiles.
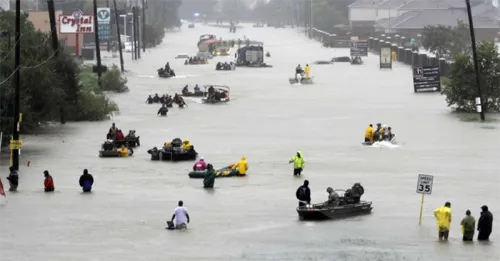
- Hurricane Harvey (Texas, 2017). Coastal regions of Texas and Louisiana were bombarded with rainfall the last week of August 2017 as Hurricane Harvey stalled between the moist air of the Gulf of Mexico and the surrounding land. Precipitation depths from the storm were some of the largest ever recorded in the United States, especially for very large areas (greater than 5,000 square miles) and long durations (longer than 24 hours). Five-day point rainfall totals of more than 60.5 inches were observed in multiple locations which exceeded by far the previous tropical cyclone record rainfall of 52 inches from Hurricane Hiki in Hawaii (1950). The average depth of rainfall from Hurricane Harvey over a 20,000 square mile area was an astounding 20 inches. Analysis of Hurricane Harvey has confirmed that it was essentially equivalent to a PMP magnitude event (Kappel & Hultstrand, 2018). At least 68 people died from direct effects of the storm, and damage was estimated at $125 billion with over 300,000 structures and 500,000 vehicles damaged by the floodwaters. During this event, much attention was given to the federally-operated Addicks and Barker Dams which provide flood protection to the Houston area. While the dams did not fail, the reservoirs behind them rose to record levels forcing operators to choose between flooding homes within the flood pool upstream of the dams and releasing more water to the already-flooded communities located downstream.
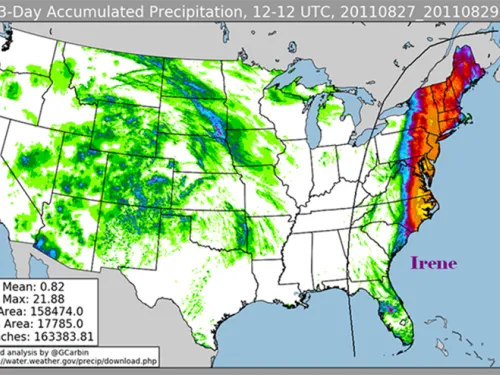
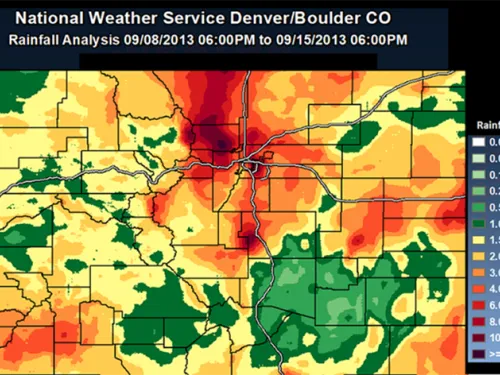
These are only a few examples of extreme precipitation events where dam incidents or failures occurred; however, many comparable events occur every year within the United States. Other recent events include Hurricane Irene in late August 2011 that caused record flooding in multiple northeastern states; the Colorado Front Range flood of September 2013 that resulted in overtopping and failure of 9 low hazard potential dams; and a tropical deluge in South Carolina in October 2015 resulting in over 50 dam and levee failures. The National Oceanic and Atmospheric Administration (NOAA) evaluates the annual exceedance probabilities for select significant storm events up to 0.1 percent or a 1,000-year average recurrence interval. This means that the average or expected period between events that equal or exceed the given rainfall depth is 1,000 years. While this may be smaller than a PMP in most instances, a 1,000-year event is still quite significant. NOAA reports that between 2010 and 2019, at least 25 storm events have occurred in the United States that have a recurrence interval greater than 1,000 years.
The historical record is clear. Extreme flood events approaching and in some cases equaling the magnitude of the PMF do in fact occur. These events can push existing dams, levees and other water control systems to their limits and should be considered when assessing and mitigating risks for these structures.
References:
(2) ASDSO. (2020). Dam Failures and Incidents. Association of State Dam Safety Officials.
(13) NOAA. (2020). Exceedance Probability Analysis for Selected Storm Events.
This lesson learned was peer-reviewed by Amanda Hess, P.E., Gannett Fleming, Inc.; and Mike Hand, P.E., Wyoh2ope.

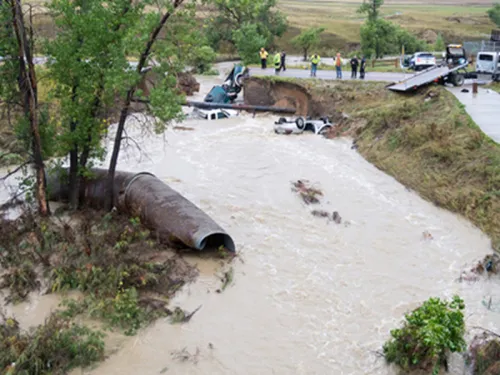
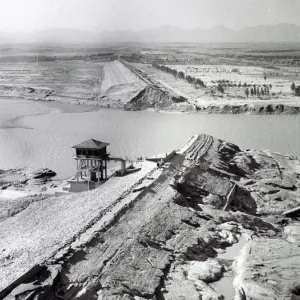
Banqiao Dam (China, 1975)

Canyon Lake Dam (South Dakota, 1972)
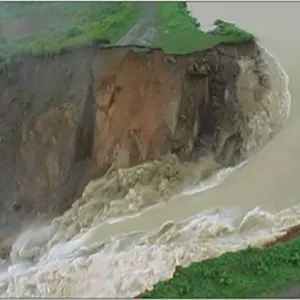
El Guapo Dam (Venezuela, 1999)

Front Range Flood (Colorado, 2013)
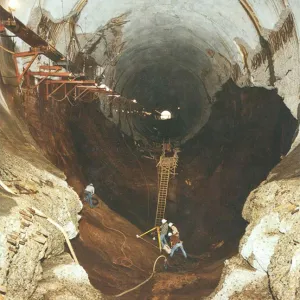
Glen Canyon Dam (Arizona, 1983)

Lake Delhi Dam (Iowa, 2010)
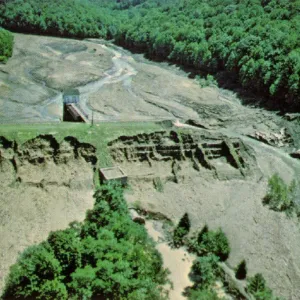
Laurel Run Dam (Pennsylvania, 1977)
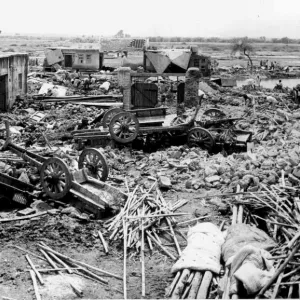
Machhu Dam II (Gujarat, India, 1979)

Schaeffer Dam (Colorado, 1921)
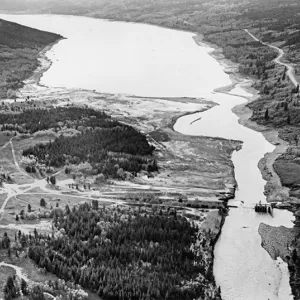
Swift and Two Medicine Dams (Montana, 1964)
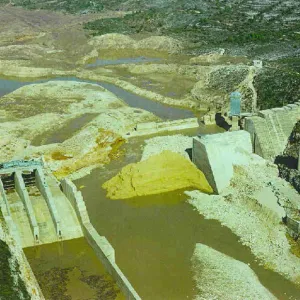
Tous Dam (Spain, 1982)
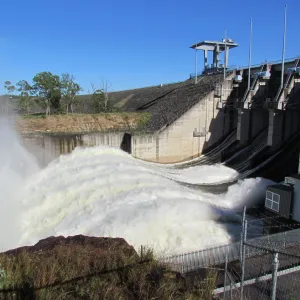
Wivenhoe Dam (Australia, 2011)
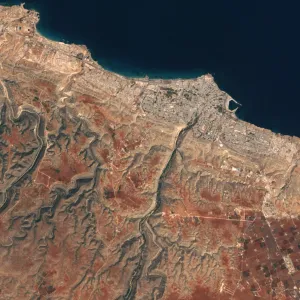
Abu Mansour & Al-Bilad Dams (Libya, 2023)
Additional Case Studies (Not Yet Developed)
- Addicks and Barker Reservoir Flooding due to Hurricane Harvey (Texas, 2017)
- Swarm of Over 50 Dam Failures in South Carolina (South Carolina, 2015)

Selecting and Accommodating Inflow Design Floods for Dams
Summary of Existing Guidelines for Hydrologic Safety of Dams
Technical Manual: Overtopping Protection for Dams
Comparison of Estimated Probable Maximum Flood Peaks with Historic Floods
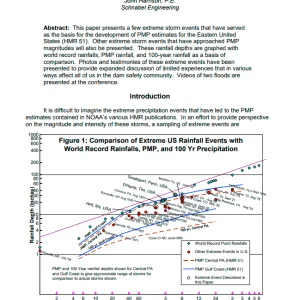
Extreme Events: Graphs, Photos, Videos
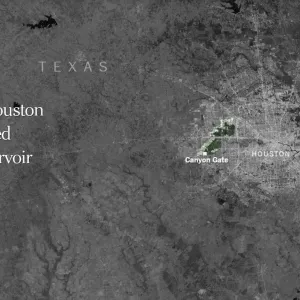
How One Houston Suburb Ended Up in a Reservoir

Living with Dams: Extreme Rainfall Events
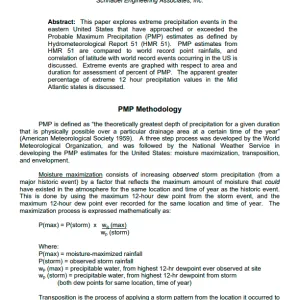
PMPs Never Happen – Or Do They?

