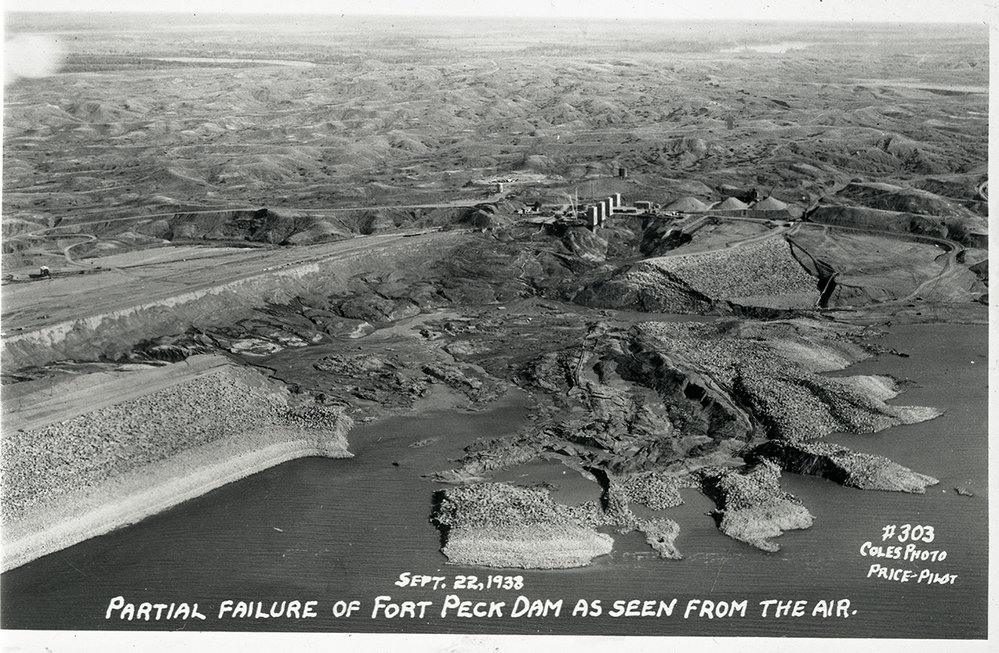
Beginning at about 1:15 pm on September 22, 1938, the upstream slope of the dam adjacent to the right abutment experienced a large failure as the construction work had progressed to within 20 feet of the final dam crest elevation (See Photo 1). One hundred eighty men were working in the area. Thirty four men were injured. Eight men lost their lives, six of whom were never found and are buried somewhere in the dam.
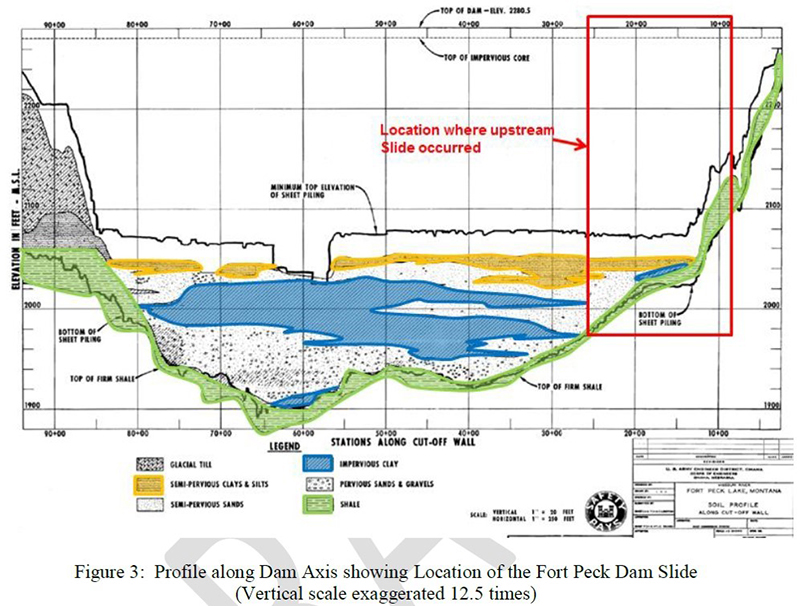
This case study presents a summary of 1) the efforts to investigate and understand the cause of the failure, and 2) the controversy concerning the root cause evaluation. The Board of Consultants for the project found that the failure was due to the inadequate shearing resistance of the weathered shale and bentonite seams in the upstream right abutment and dam foundation (see Photo 2). They further indicated that “the extent to which the slide progressed upstream may have been due, in some degree, to a partial liquefaction of the material in the slide.”
During the 2018 re-examination of the failure (Redlinger et. al., 2018, Berre and Ferguson, 2019), it was found that there has been significant technological advances in the characterization of the shear strength of clay materials. The concerns related to the weathered shale and bentonite seams that were thought to have triggered the Fort Peck slope failure merit continued review during periodic re-evaluation of risks. The contribution of liquefaction during construction has been the focus of multiple investigations, to assess the liquefied strength of the hydraulic fill and shallow foundation sand. The root cause can be attributed to the limitations of dam design technology available at the time. Specifically, laboratory testing and design procedures did not exist related to the shear strength of a) the clay shales in the upstream right abutment (that may have initiated the failure event), and b) potentially liquefiable hydraulic fill being used to construct the dam and the foundation sand materials. Technology exists today to assess these mechanisms and confirm the safety of the structure.
The Fort Peck slope failure had a significant impact on the U.S. Army Corps of Engineers (and industry wide) design methods and construction procedures. Further, the use of hydraulic fill construction methods for embankment dams was generally discontinued in the United States following the Fort Peck dam failure event.
Pertinent data on the Fort Peck Dam and reservoir are as follows:
- Hydraulic Filled & Rolled Earthfill Dam with a Sheet Pile Foundation Cutoff Wall.
- 125,628,000 Cubic Yards of Fill Placed.
- 3,000,000 Cubic Yards of Gravel Placed in Upstream and Downstream Gravel Toes.
- Length (Including Dike Section) - 21,026 Feet.
- Maximum Height above Streambed - 250 Feet.
- Maximum Width at Base - 4,900 Feet.
- Crest Width - 50 Feet.
- Closure Date - 24 June 1937.
- Total maximum storage capacity: 18,463,000 ac-feet
- Installed capacity: 185 MW
- Spillway Capacity: 275,000 cu ft/sec
Hydraulic filling was selected as the most cost effective option to construct the embankment dam, otherwise the cost of building the dam would not have been economically justifiable. Closure of the main river channel with river diversion through the tunnels was completed on 24 June 1937, allowing more aggressive mass placement of the remaining embankment fill. Monitoring for distress or problems with the hydraulic fill was a daily routine. As the fill rose, workers routinely walked the slurry pipelines on the dam to look for sags and daily reporting was required due to concern for overtopping the upstream bank.
The U.S. Army Corps of Engineers (USACE) report on the slide (1939) notes the following:
“On the morning of September 22, 1938, the usual inspection was made by the principal engineer in charge of construction, his assistant, the fill superintendent, the associate superintendent in charge of levees and the fill inspection force. At about 10 am, their findings were discussed at the conference held on the crest of the upstream face near station 15+10. The fill inspectors and the assistant superintendent of construction stated that there did not appear to be sufficient freeboard. An immediate inspection of that point disclosed, by rough measurements that the height of the bottom of the pipe line above the core pool was only 30 inches, whereas it should have been 4.5 feet. …. At about 11:45 am, the survey crew submitted the following data:
Station 15 – Pipe line 3 feet above the core pool; (should have been 4 1/2 feet. Station 16 – 3 feet; should have been 4 1/2 feet Station 17 – 2.8 feet (should have been 4 1/2 feet)”

At this point in time the elevation of the core pool was 2252, the elevation of the reservoir was 2117.5 and the dam was nearing completion. When additional observations confirmed that the water level of the core pool had not changed from the day before, it was realized that the upstream embankment near the right abutment (east) was apparently settling. Project leader, Clark Kittrell went to the site in the early afternoon. His driver, Eugene Tourlotte, approached from the west and arrived at the site about 1:15. Tourlotte saw the upstream shell begin to move out beneath the car, slammed on the brakes and went in reverse at high speed to successfully out run the slide. During the next ten minutes railroad tracks, trains, boats, pipelines, and thirty-four men were on the 1700 foot-wide mass as it slid. Over 5 million cubic yards of material came loose from the dam, and five percent of the structure was destroyed. When it came to rest, some of the equipment was submerged and eight men were dead, buried in the slide. Twenty-six men successfully rode out the slide.
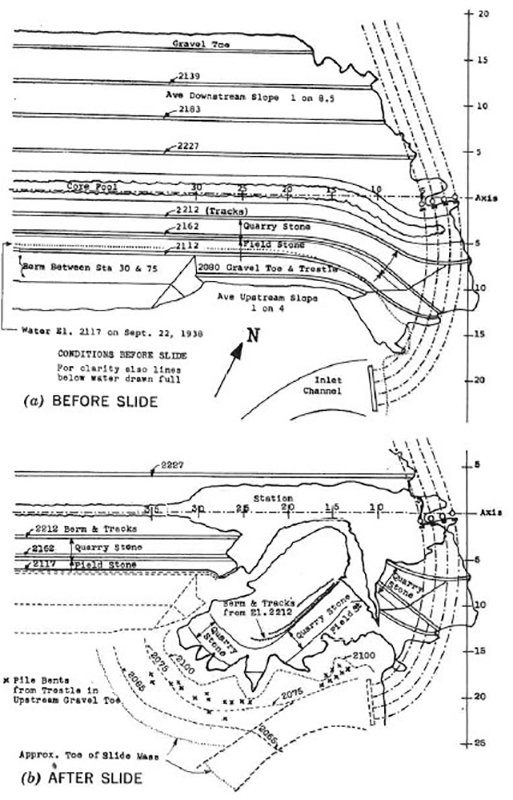
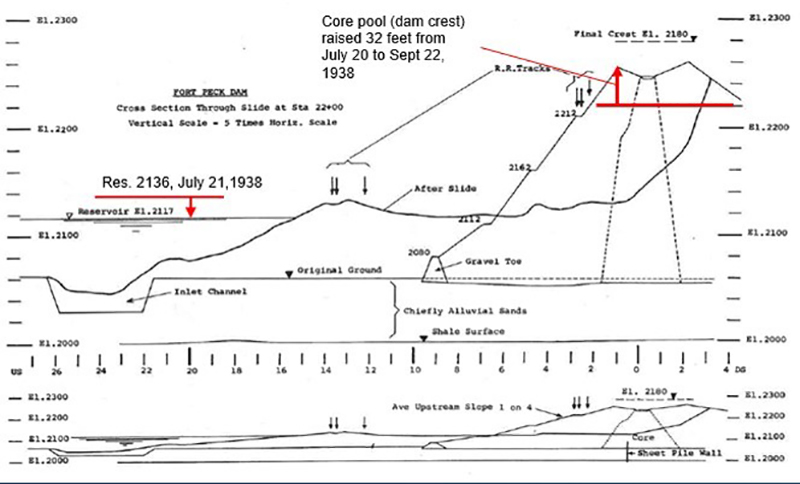
An illustration of the plan view of dam near the right abutment where the failure occurred before and after the slide is shown on Photo 3. Note the area of the failure was the only location along the upstream slope of the dam where a stability berm was not included. A cross-section through the failure that shows the before and after configuration of the embankment is shown on Photo 4. The rapid rise of the crest combined with the lowering of the reservoir pool between July and September (shown in red) combined to create the undrained loading that caused the failure.
Immediately after the slide the original Board for the design of the dam was expanded to include:
- Dr. Arthur Casagrande - Professor of Soil Mechanics at Harvard University
- Mr. I.B. Crosby - Consulting Engineering Geologist
- Dr. Glennon Gilboy - Consulting Engineer, former Prof of Soil Mech, MIT
- Mr. Joel D. Justin - Chairman, Consulting Engineer Phil. PA, co-author of “Engineering for Dams”
- Mr. William H. McAlpine - Office of the Chief of (USACE) Engineers
- Mr. C. W. Sturtevant - Division Engineer
After an extensive site characterization and laboratory testing program in the area of the slide, the Board of Consultants arrived at the following conclusion on the cause of the slide 6 months after it had occurred:
“After careful consideration of all the pertinent data the Board has concluded that the slide in the upstream portion of the dam near the right abutment was due to the fact that the shearing resistance of the weathered shale and bentonite seams in the foundation was insufficient to withstand the shearing forces to which the foundation was subjected. The extent to which the slide progressed upstream, may have been due, in some degree, to a partial liquefaction of the material in the slide.” March 2, 1939 Board Report
This brief conclusion about the cause of the failure from the Board emphasizes the shear strength of the shale and bentonite seams in the foundation. It may seem obvious given the right portion of the slide was the only location where a portion of the dam was likely founded directly upon a shelf in the shale materials and this is where the first movements were detected. As the top of shale dipped beneath the left portion of the slide the shale became buried to a maximum depth of about 40 to 60 feet of alluvium at the left limit of the slide, at least on centerline. The back analysis that formed the basis of the redesign focused on the strength of the bentonite shale materials while lab testing was completed to address the strength of the clay shales and to determine if liquefaction had occurred (U.S. Army Corps of Engineers, July 1939).

Two of the nine board members, Merriman and Mead, did not sign the report: One for technical reasons and one for more philosophical reasons. A couple of the Board members (Drs. Casagrande and Gilboy) were convinced that liquefaction had occurred even though the results from the lab testing to estimate the critical void ratio (Casagrande, 1936) of the hydraulic fill indicated that the materials would not have liquefied (Middlebrooks, 1942). Gilboy, in his discussion on the 1942 paper by Middlebrooks first articulated the view of the minority on the Board who concluded “that liquefaction was triggered by shear failure in the shale, and that the great magnitude of the failure was principally due to liquefaction.” Casagrande remained silent on the subject until his Terzaghi lecture in 1965 where he reveals that the language of the Boards report was “a compromise wording to bridge the wide gap in the views of the consultants who signed the report.” Casagrande goes on further to say that “Gilboy and I shared the opinion that the liquefaction was centered principally in the fine sand zone of the shell next to the core, and that liquefaction may have spread into the underlying heavily loaded foundation sands.”
A detailed review of the technology available at the time of design and post failure evaluation, along with the human factors at play in light of the inadequate technology that was recently performed by Redlinger, Ferguson and Berre (Redlinger, et al, 2018) as well as Berre and Ferguson (ASDSO Webinar, August, 2019). These reviews found the following:
- Key contributing factors contributing to the failure of the upstream slope of the dam were associated with the inadequate technology and design procedure associated with both of the following:
- the shear strength of the clay shale foundation materials including what we now refer to as “residual strength”, and
- the strength characterization of hydraulic fill materials and the mechanism of “liquefaction”.
- The classification of clay shales and the impact of slickensides, faults and other pre-sheared surfaces was not well understood. The potential for high pore pressures to develop in the stiff fissured shales as a result of construction loads was also not anticipated. The soil classification system that was used was of limited value as compared to the Unified Classification that would arrive nearly two decades later.
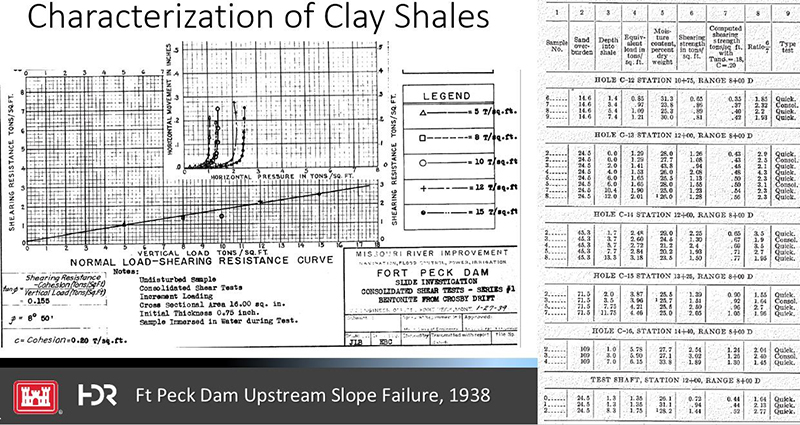
- Characterization of the shear strength of the foundation materials, including the bentonite seams in the clay shales, was not yet a standard design practice. While the issue of the strength of these materials and potential for failure had been identified, a full understanding of the strength properties, and the ability to characterize the strength for design was limited. These strengths were not identified until the post failure investigations. Post-failure investigations did indicate bentonite materials with strength as low as just less than 9 degrees (see Photo 5). To the author’s knowledge, the use of a lower strength corresponding to what we would classify today as “residual strength” of the clay shales in the back analysis of the slide failure by the Board of Consultants, was the first such application of such strength in the design of a slope for a dam.
- While the concept of liquefaction (critical density/void ratio, Casagrande, 1936) was beginning to be understood from a number of case histories such as the failure of Calaveras Dam in California (1918), the ability to properly characterize and assess the actual strength of the hydraulic fill materials either during design or as part of the post failure assessment was limited at best. Further, there was no understanding of how the rate of construction and pool lowering that occurred from the period of July 20th to September 22nd would impact water pressures in the dam and foundation, the strength of the clay shales and hydraulic fill materials, and ultimately the stability of the upstream slope of the dam.
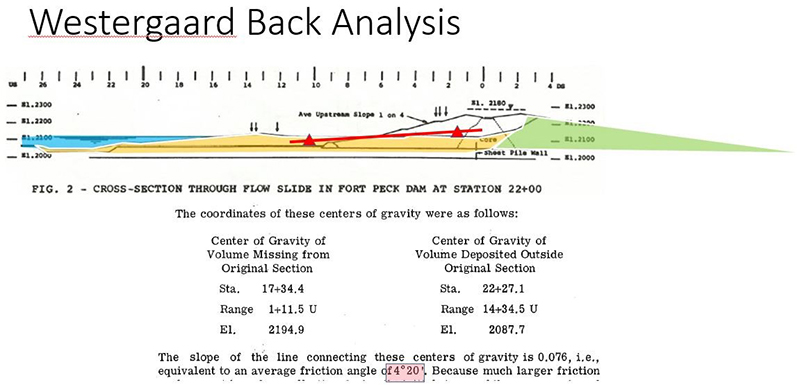
A post failure evaluation by Westergaard (Casagrande, 1965) suggested that the average friction angle of a little more than 4 degrees was acting along the base of the slide mass during failure. The method Westergaard used to estimate the strength was by the construction of a line between the estimated centers of gravity of the before and after embankment cross section as shown on Photo 6. For more than 80 years since the failure, many researchers have taken on the challenge of back analyzing the average “residual strength” of the material in the failure mass at Fort Peck Dam. As summarized by Redlinger et al (2018), it appears that Westergaard’s simplified evaluation was pretty close to the mark. However, the issue of how to estimate the residual strength of potentially liquefiable materials is still a major challenge to engineers.
The 2018 and 2019 re-examinations (Redlinger et al, 2018; and Berre and Ferguson, 2019) of the failure found that there were a number of distress signs that indicated the failure was imminent. Those distress indicators included: 1) bowing of the railroad tracks at Station 15 to 17, 2) settlement of the slurry pipe and longitudinal embankment cracking along the upstream edge of the crest, and 3) high water pressures in the embankment and seepage emanating from the first bench (quarry stone) along the upstream slope below the core pool the night before the failure.
References:
(2) Casagrande, A. (1936). Characteristics of Cohesionless Soils Affecting the Stability of Slopes and Earth Fills. Journal of the Boston Society of Civil Engineer. Vol. 23, No. 1.
(3) Casagrande, A.. (1965). Role of the “Calculated Risk” in Earthwork and Foundation Engineering. The Terzaghi Lecture, Journal of the Soil Mechanics and Foundations Division, Proceedings of the American Society of Civil Engineers.
(4) Gilboy, G. (1942). Discussion on the Middlebrooks article “Fort Peck Slide”. Transactions of the American Society of Civil Engineers, Vol. 107, pp 725-755.
(6) U.S. Army Corps of Engineers. (1939). Report on the Slide of a Portion of the Upstream Face of the Fort Peck Dam. U.S. Govt. Printing Office, Washington, D.C.
This case study summary was peer-reviewed by Laila M. Berre, P.E., US Army Corps of Engineers.


Lessons Learned

Dam incidents and failures can fundamentally be attributed to human factors.
Learn more
Earth and rockfill embankment dams must be stable under the full range of anticipated loading conditions.
Learn more
Intervention can stop or minimize consequences of a dam failure. Warning signs should not be ignored.
Learn more
Stability of the dam foundation and other geologic features must be considered during dam design.
Learn more
Static liquefaction should be considered as a potential failure mode for dams that have loose sands or silts in their embankments or foundations.
Learn moreAdditional Lessons Learned (Not Yet Developed)
- Need to better understand the mechanism of liquefaction and characterize shear strength of potentially liquefiable materials.
- Need to better understand the shear strength of clays and clay shales and how to use “Residual Strength” of clay shales in design.
- While a number of distress indicators were present that foretold the failure of the slope, the understanding at the time did not provide a basis to take actions that would have prevented loss of life.
- The observation of increased water pressures and seepage emanating from the quarry stone bench along the upstream slope of the dam may have been one of the most important indicators of a liquefaction failure.*
- The Fort Peck dam upstream slope case history suggests that when such conditions develop, failure may be imminent and extreme caution is necessary to protect life and property as intervention would not have saved the structure.
* The seepage distress indicator that was found in an obscure reference noted in the 2018 paper by Redlinger, Ferguson and Berre may be an important finding in light of the recent liquefaction failure of the Corrego Do Feijao Tailing Dam, Brazil on January 25, 2019. That failure may have showed some similar conditions prior to the failure. Further evaluation of this distress indicator is suggested as both case histories may provide evidence that when such conditions develop, failure may be imminent and extreme caution is necessary to protect life and property as intervention in both cases would not have saved the structures.

80th Anniversary of the Fort Peck Dam Construction Slide

Effect of Geology on Uplift and Dam Stability

Embankment Slope Instability
Additional Resources Not Available for Download
- Casagrande, A. (1936). Characteristics of Cohesionless Soils Affecting the Stability of Slopes and Earth Fills. Journal of the Boston Society of Civil Engineer, Vol. 23, No. 1.