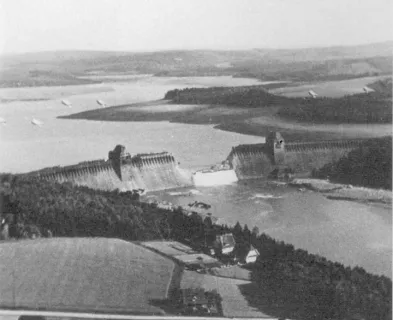
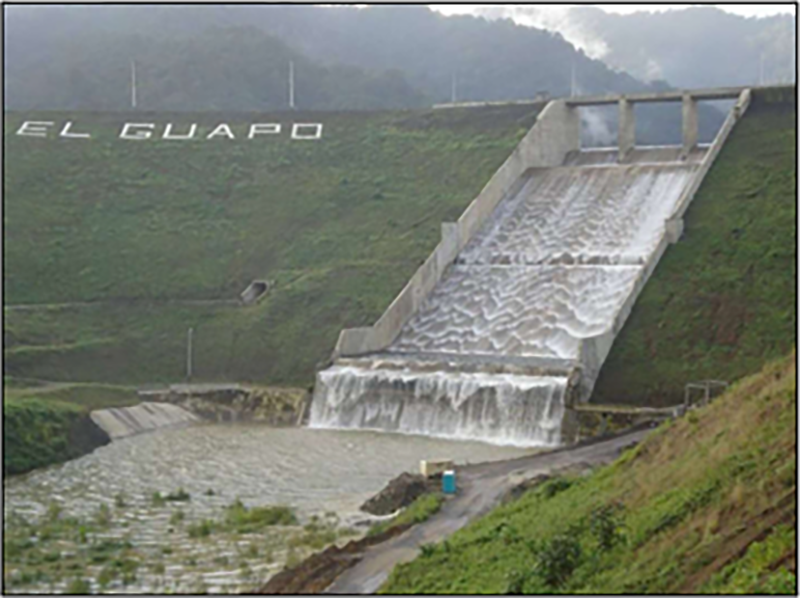
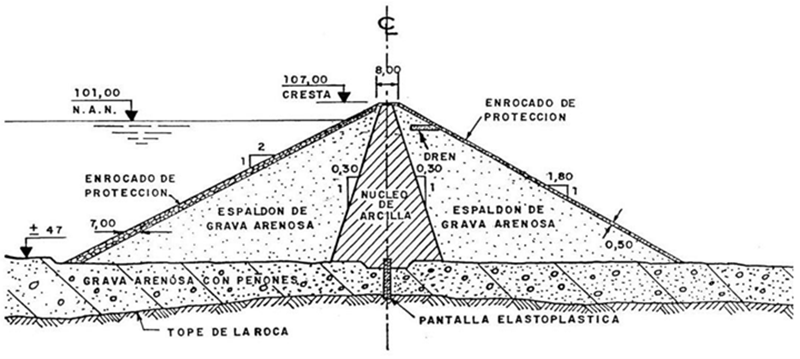
Construction of El Guapo Dam began in 1975 and was completed in 1980. The dam is 197 feet tall and stores 114,000 acre-feet of drinking and irrigation water for the Barlovento Region in the state of Miranda, Venezuela. Because bedrock is deep (approximately 65 feet below the original ground surface), the embankment was built on a sandy gravel soil foundation. An elastoplastic cutoff wall extends down from the clay core and ties into bedrock. The embankment shells are constructed of a sandy gravel material and armored with riprap. El Guapo dam had an eventful history including: a successful intervention that prevented a potential piping failure; a storm event that caused the pool to rise to within 3.3 feet of the dam crest (7.8 feet above the peak pool level of the inflow design flood [IDF]); and a reservoir breach due to overtopping of the spillway training walls. Each of these events and the lessons learned are described herein.
Near Piping Failure
At the beginning of the dam’s service in 1980, clearwater seepage at the left and right abutments and at the toe of the dam was observed between 2.1 to 3.5 cubic feet per second (cfs). This behavior was monitored closely and a program for reading the installed piezometers was established. During the readings, a high-pressure anomaly was found in the clay core suggesting the formation of a fissure or other defect. High pressure readings were also found in the dam’s foundation, downstream of the cutoff wall. After further investigation, a concentrated leak was confirmed between the clay core and the cutoff wall. Intervention began immediately to seal the leak and stabilize the embankment. As the downstream riprap shell was cleared, it was observed that seepage was not only occurring at the abutments and at the toe of the dam but also on the downstream embankment slope, 120 feet above the toe of the dam. The seepage was clear, suggesting no removal of embankment material (Suárez and Suárez 2016).

Analyses found that due to the increased pore pressure and large saturated portion of the embankment, the downstream slope of the embankment dam was barely stable, with a factor of safety of approximately one, indicating failure was imminent. Thirteen relief wells were constructed and injected with cement with the intent of sealing the leak at the downstream face of the clay core. This effort had little success at reducing the seepage. Next, material was added to the downstream embankment to form a supportive, stabilizing embankment at a flatter 3H:1V slope (original slope was 1.8H:1V). Calculations showed that the stabilizing embankment slopes increased the factor of safety to above 1.5. A drain was also constructed down both abutments and at the interface between the original embankment and the new supportive embankment; its function was to capture seepage and not allow it to saturate the modified embankment. These intervention measures were completed in 1995, taking a total of 15 years to complete. While seepage was not greatly reduced, the dam was stable (Suárez and Suárez 2016).
This near failure at the beginning of the dam’s service highlights the need for quality control and assurance during the construction process. Deficiencies during design (e.g., lack of filter and drain, steep 1.8H:1V slope) and construction (e.g., clay core/cutoff wall interference and a crack in the clay core) nearly caused the dam to fail. Although failure did not occur, intervention was costly. This experience also reiterates the need to closely monitor seepage, regularly inspect earthen embankments for imperfections, and intervene when deficiencies are found. Because of the intervention, the embankment was stabilized, and a potential dam failure was avoided.
Inadequate Spillway Capacity and Dam Failure
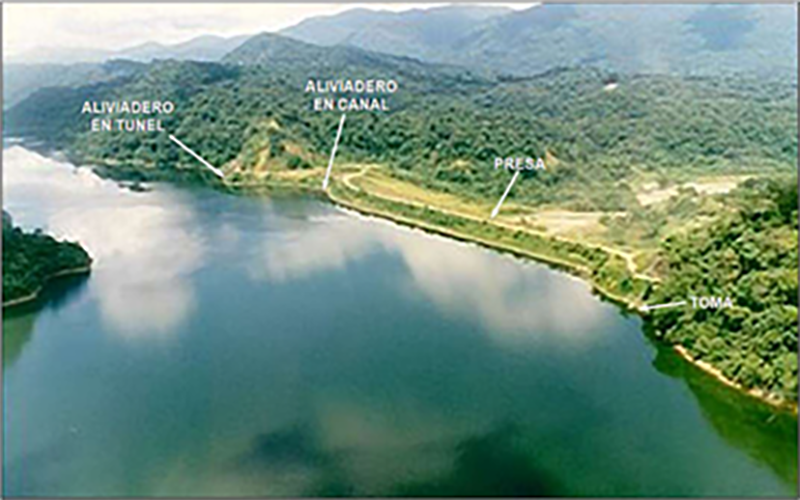
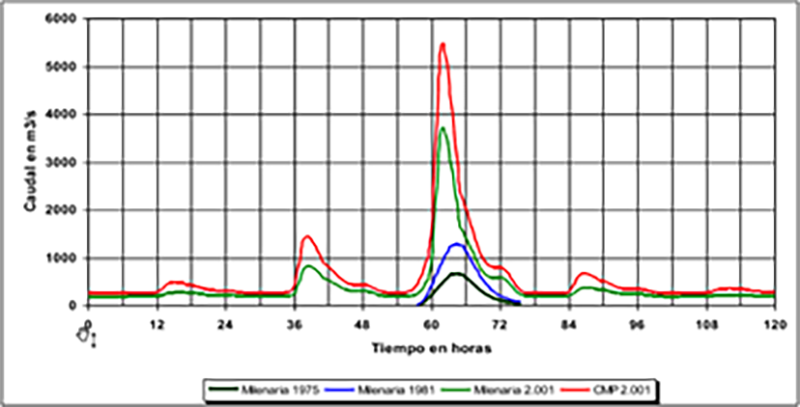
The original dam had a 39.4-foot-wide concrete ogee spillway at El. 331.4 feet that discharged into a rectangular spillway chute and a hydraulic jump stilling basin that was designed using United States Bureau of Reclamation methods. The spillway’s capacity was designed at 3,600 cfs with 8.6 feet of head and 11.1 feet of freeboard (dam crest El. 351.1 feet), corresponding to the 10-3 (1:1,000) annual exceedance probability (AEP) event. Prior to construction, a 1975 hydrologic study estimated the 10-3 AEP inflow for the proposed dam’s 183 square mile watershed to be 23,700 cfs. This study used hydrologic data transferred from a nearby gaged watershed on the Rio Cuira whose hydrologic characteristics were considered similar to El Guapo’s (Suárez and Suárez 2016). It is unclear why the design was not revised based on the 1975 study results.
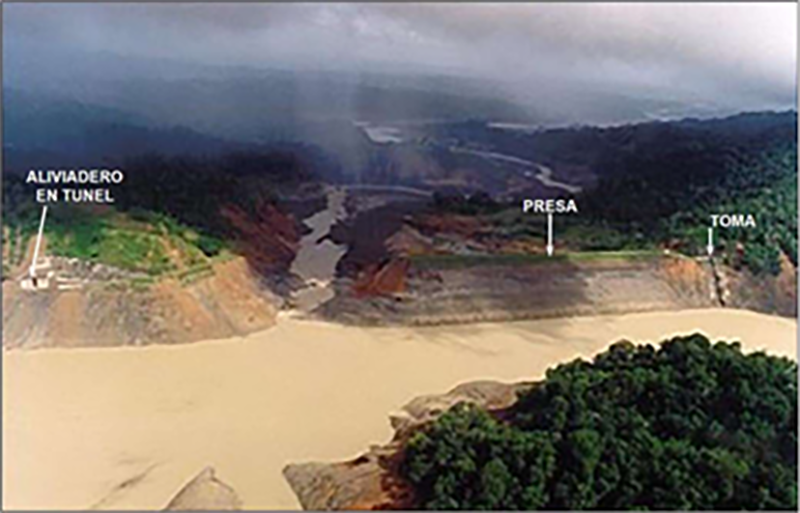
On April 12, 1981, during the final phase of spillway construction, a storm caused the pool level to rise 7.8 feet above the 10-3 AEP inflow design flood (IDF) pool level. It was evident the spillway was undersized. A new hydrologic study was conducted that increased the 10-3 AEP inflow to 45,100 cfs, a 90% increase over the previous estimate. The methods used for this updated study were not stated in the reviewed literature. The decision was then made to construct a secondary spillway. The secondary spillway was a 96.9-square-foot tunnel section controlled by a radial gate and located at the left abutment. The new spillway’s crest was 19.7 feet below the ogee spillway crest, and the radial gate was 19.7 feet tall and 9.8 feet wide, allowing the normal pool to be maintained at El. 331.4 feet (Suárez and Suárez 2016).

In 1999, two periods of intense precipitation, that had not previously been exceeded, created widespread flooding that killed or injured thousands and caused immense damage to Venezuela’s infrastructure. The first period occurred during March and April in the country’s central region which caused various bridges to collapse. The second period occurred throughout December 1999 and January 2000 and was concentrated over the Venezuelan states of Vargas, Miranda, and Falcon, near the central coastal region of Venezuela. Nine hundred and eleven millimeters (23.14 inches) were recorded in Maiquetía, Vargas, Venezuela (approximately 100 miles northwest of El Guapo) on December 14, 15, and 16 (Cárdenas 2000). The estimated peak discharges due to these storm events exceeded the 10-3 AEP (the dam’s IDF) and probable maximum flood (PMF) estimates for various river systems. The methods used to estimate peak flows at the time resulted in significant underestimation of flooding potential, as was demonstrated in the two aforementioned hydrologic studies for El Guapo (Suárez and Suárez 2016). This series of extreme precipitation events in December 1999 led to El Guapo’s failure.
The failure progression of the dam on December 16, 1999 was documented by a hydraulic engineer, Alfredo Hitcher, who was on site and is summarized as follows: December 14th:
- Precipitation caused the pool level to rise 3.0 feet (16.7 feet below the top of the dam). The secondary spillway’s radial gates had already been fully open since June 27, 1999.
December 15th
- 5:00 pm: The pool rapidly rose an additional 14.0 feet and was then only 2.6 feet below the dam crest. An hour later the low-level outlet works were opened to increase the dam’s discharge capacity. With all control structures opened, no other interventions were taken to save the dam or delay failure.
December 16th
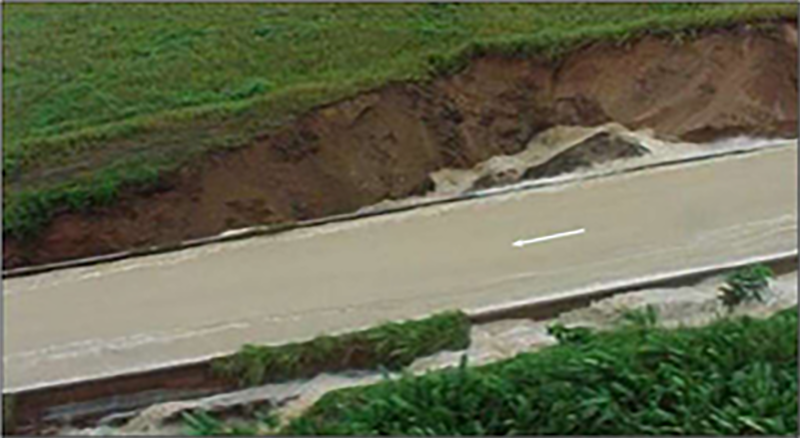
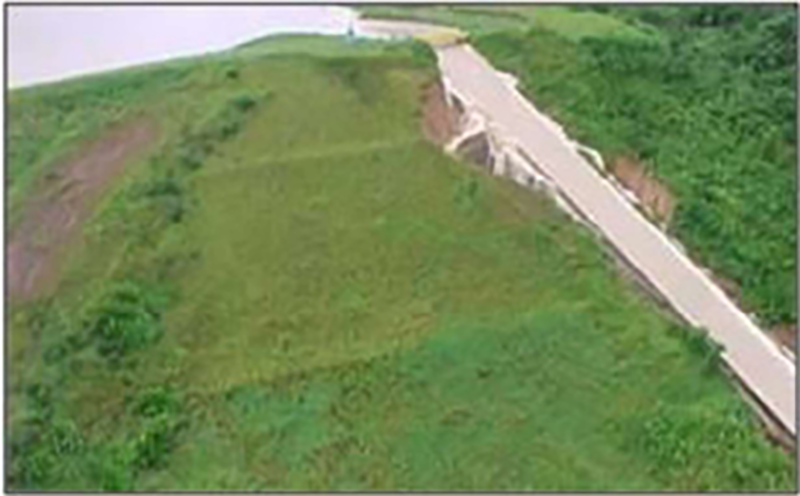
- 1:15 am: The pool level was now just 8 inches below the dam crest. A short distance from the control section, the spillway training walls began to overtop, and the adjacent embankment material began to erode.
- 4:30 am: The Governor of Miranda made the decision to evacuate the downstream population.
- 9:00 am: The pool level had fallen to 2.6 feet below the dam crest. Those present believed the storm was now on its falling limb and felt a great sense of relief. A few hours later the pool fell an additional 0.7 feet. However, the downstream population was not yet allowed to return to their homes.
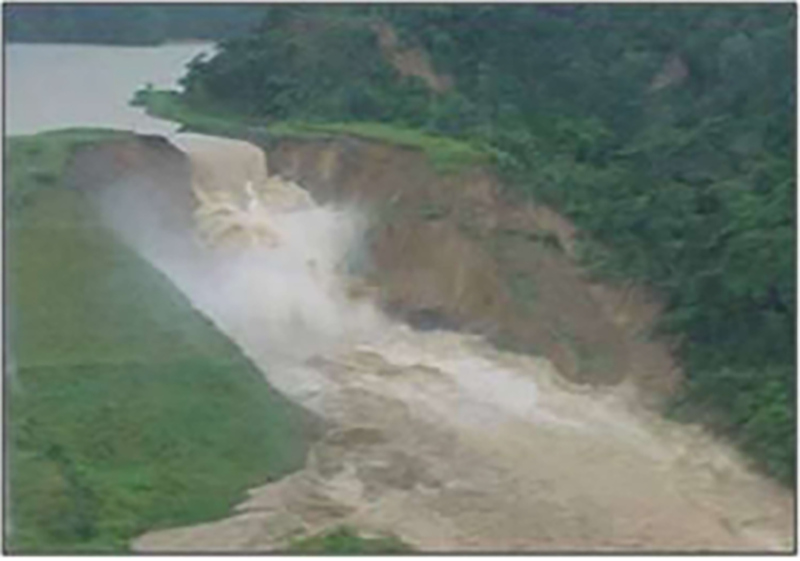
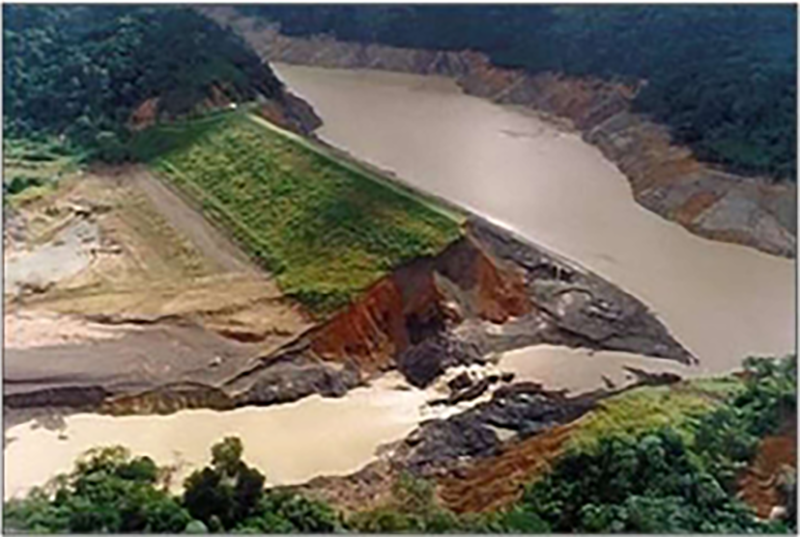
- 4:00 pm: Once more, the reservoir rapidly rose. The bridge over the ogee spillway collapsed and the erosion behind the training walls progressed and undermined the spillway chute and stilling basin causing them to collapse. The concrete-lined approach channel was still intact and controlling the reservoir's discharge.
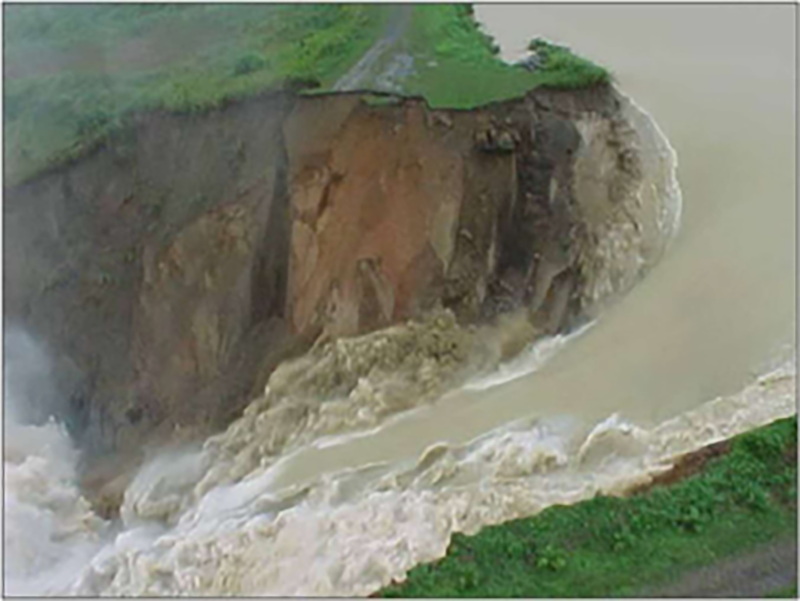
- 5:00 pm: The approach channel collapsed and headcutting progressed upstream and led to the breach of the reservoir approximately one hour later. The breach released 98 feet of reservoir depth within 40 minutes (Suárez and Suárez 2016).
The peak outflow from the flood was approximated at 1.8 million cfs, with the flood wave between 25 and 40 feet tall. THe resultant flood destroyed 1.6 miles of highway; a bridge over the Guapo River; and downstream villages, farmland, and forested areas. The Barlovento region was left without its main source of potable water. Despite the evacuation orders (more than 10,000 people [Pedicini 2019]), a few sources estimated 10 to 20 deaths (Pedicini 2019), and 11,000 to 15,000 impacted. The cost of damages is unknown, but 800 to 1,200 homes were destroyed (Pedicini 2019) and another 1,500 were damaged (Suárez and Suárez 2016).
The dam never overtopped. The failure was first caused by the erosion of embankment material behind the walls; second, by the collapse of the concrete spillway chute due to undermining; and finally, by the erosion occurring at the spillway foundation which consisted mostly of erodible weathered shale. To prevent this failure mode on existing structures where training wall overtopping is of concern, spillway chute walls should be raised or otherwise modified to increase capacity. The previous seepage problems did not appear to contribute to the breach.
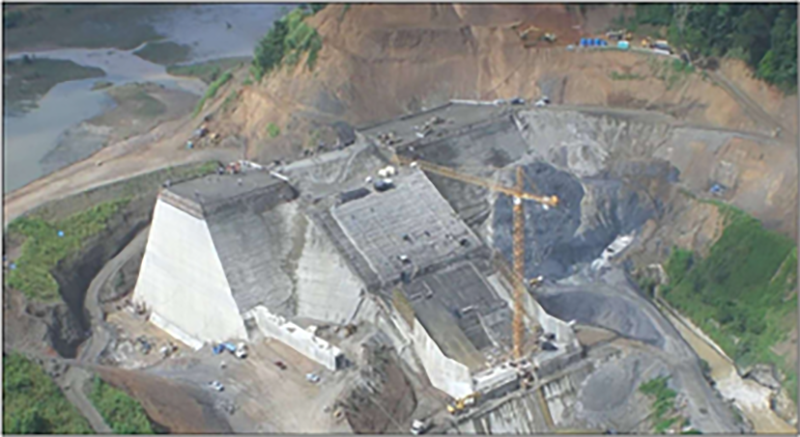
Reconstruction of the dam began in 2005 and was completed in 2007. The breach was filled with roller compacted concrete (RCC), which would form the foundation for a new ogee spillway. The IDF was increased from the 10-3 AEP event to the probable maximum flood (PMF). In calculating the new PMF, various hypothetical events were superimposed to create multiple rainfall peaks to more closely replicate the temporal behavior of the December 1999 storm which caused El Guapo Dam to fail. Previously, the dam’s 10-3 AEP IDF was increased by 90% prior to failure, which led to the construction of a secondary spillway that likely prevented overtopping of the dam during the December 1999 event. However, this new analysis further increased the 10-3 AEP inflow estimate by an additional 280% highlighting the severity of previous underestimates. Reference to these studies could not be found and it is unclear what hydrologic assumptions changed to increase the peak flow estimates (Suárez and Suárez 2016).
The new spillway was designed to convey the PMF at 95,400 cfs, 27 times larger than the original IDF. To achieve this, the spillway crest width was increased from 39.4 feet to 141.1 feet and the spillway crest was lowered by 13.1 feet (Suárez and Suárez 2016).
The following lessons can be learned from this tragedy relating to the design and analysis of hydraulic structures:
- Spillway hydraulics are complex, and engineers must reduce uncertainty as much as possible. While El Guapo Dam’s spillway may have been undersized, the failure was not due to insufficient discharge capacity of the control section. The spillway training walls overtopped, and erosion began while the dam still had 8 inches of freeboard. To prevent this in new designs and assessments, engineers must understand the potential for complex hydraulic behaviors such as air bulking in flow, cross waves creating additional flow depths in the chute, and the location and conjugate depth caused by a potential hydraulic jump. Journal and Federal publications can be used to initially estimate a spillway’s water surface profile. However, each spillway is unique, and designs and assessments can ultimately be verified using a computational fluid dynamic (CFD) and/or a physical hydraulic model. These models should be applied where non-symmetrical flow in the spillway chute, rapid convergence or divergence of flow, the potential for air bulking, or marginal freeboard on the chute walls may be expected.
- Spillways should not be built on erodible foundations. A non-erodible foundation for El Guapo Dam’s auxiliary spillway may have prevented the breach of the reservoir due to this incident. This lesson was applied in the redesign of the spillway for the 2005 reconstruction, by founding the auxiliary spillway on an RCC foundation which was in turn founded on bedrock.
- Dam designers and regulators should have a clear understanding of downstream consequences and tolerable societal risk. With an estimate of 10 to 20 deaths, and 11,000 to 15,000 impacted during the failure, El Guapo Dam could clearly be classified as a high hazard potential structure based on the United States Federal Emergency Management Agency (FEMA) federal dam safety guidelines (original hazard classification was not found in the reviewed literature). While the initial 10-3 AEP IDF could have been a standard of practice in Venezuela at the time, in hindsight it was a severe regulatory underestimate of the discharge capacity needed to protect the downstream population and the dam itself creating a disparity between probability of failure and tolerable societal risk. To prevent similar disparities from occurring, the dam safety industry needs to understand the downstream consequences and the level of societal protection required. To help achieve this, FEMA has published several federal dam safety guidelines including FEMA P-94 (2013) and FEMA P-1025 (2015). During reconstruction, El Guapo’s spillway capacity was increased to convey the PMF, which is consistent with the prescriptive IDF standards in FEMA P-94.
- Dam engineers need to understand the uncertainties inherent in modeling complex hydrologic processes. The meteorologic and hydrologic methods used to estimate El Guapo’s initial 10-3 AEP IDF were inadequate, creating a design event with an actual AEP much higher than 10-3, lessening the assumed level of societal protection provided by the spillway. In essence, the likelihood of failure due to spillway inadequacy was higher than expected due to an underestimation of the 10-3 AEP IDF magnitude. When modeling complex hydrologic systems, modelers need to understand the limitations of each method applied and the meteorologic and basin response behaviors of the study region. To better quantify uncertainty, modelers should perform sensitivity analyses to understand the range of reasonable results possible and calibrate to best available data.
References:
(2) Pedicini, V. (2019). La furia de El Guapo. El Estímulo. Accessed on February 25, 2021.
(6) Admin. (2006). El Guapo dam to be rebuilt. (2006). International Water Power & Dam Construction.
This case study summary was peer-reviewed by Paul Schweiger, P.E. (GFT), Bill Fiedler (HDR), and Lee Mauney, P.E. (HDR).


Lessons Learned

Concrete-lined spillways are vulnerable to significant damage and potential reservoir breach if flows are not safely contained within the conveyance structure.
Learn more
Downstream of constructed spillway exit channels, spillway outflows can erode and even breach dam embankments and can adversely impact the operation of outlet works.
Learn more
Extreme floods do occur.
Learn more
High and significant hazard dams should be designed to pass an appropriate design flood. Dams constructed prior to the availability of extreme rainfall data should be assessed to make sure they have adequate spillway capacity.
Learn more
High and significant hazard embankment dams should have internal filter and seepage collection systems.
Learn more
Intervention can stop or minimize consequences of a dam failure. Warning signs should not be ignored.
Learn more
Timely warning and rapid public response are critical to saving lives during a dam emergency.
Learn moreAdditional Lesson Learned Information
- Spillway hydraulics are complex. Complex analyses, often including a CFD or physical hydraulic model, can be used to reduce uncertainty and understand a spillway’s behavior under a range of operating conditions.
- There is uncertainty in hydrologic modeling. Sensitivity analyses, model calibration, and conservative assumptions should be used in developing inflow design floods.
- Spillways should be founded on non-erodible foundations. Had El Guapo’s auxiliary spillway been constructed on a more erosion-resistant foundation, the complete breach of the reservoir may have been avoided.